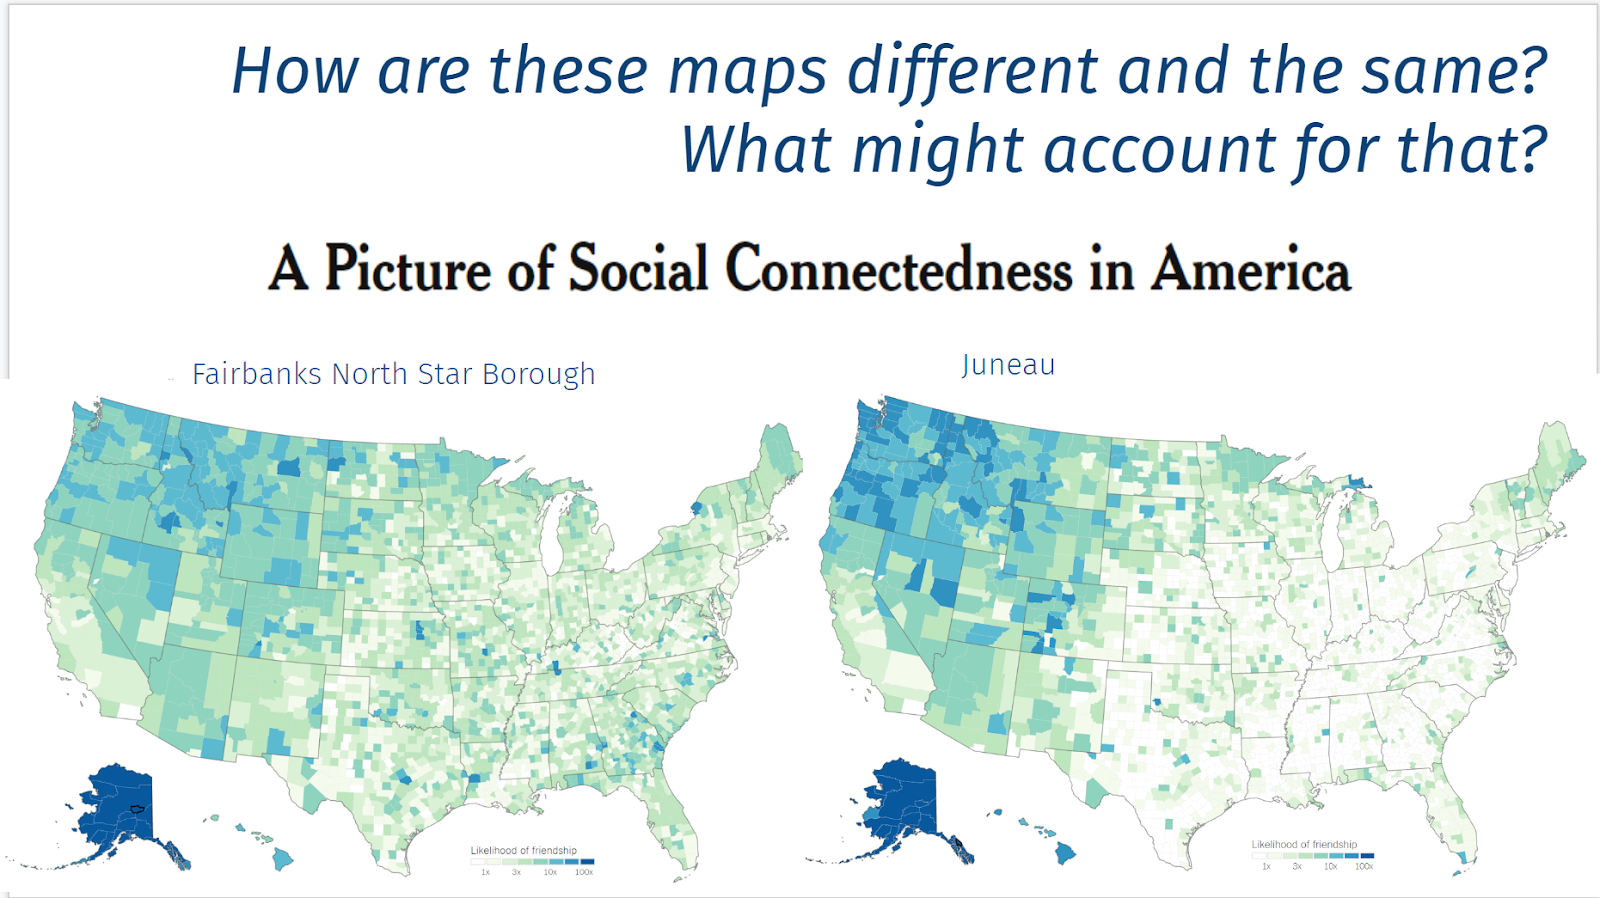
State Representation

Notice, Wonder, Connect
Slow Reveal

This bar graph focuses on state legislators. It shows the ratios of population to state representative and to state senator.  How do the ratios in Alaska compare to those in other states or the national average?  What factors might influence how these ratios vary from state to state?

As seen in this graph, the proportion of population to legislators tends to increase as the population size of the state increases (California has the largest population and the largest proportion) but this is not always the case. Alaska’s population is the third smallest (after Wyoming and Vermont), but its proportion of population to senators is the 7th smallest and its proportion of population to representatives is 10th smallest.  

The United States has a federalist government. This means the powers are shared between a federal government and a state government. While we often spend time talking about the federal government, the state government plays an equal (and in many ways, greater) role in your day-to-day life. Like the federal government, most states have a legislature with two chambers (called a bicameral legislature). The one exception is Nebraska which only has state senators and no state representatives (called a unicameral legislature).

Both the federal government and state governments have to find a balance when deciding the size of their legislative bodies. A larger body means more representation and potentially more different voices heard but also could mean too many people talking, more money spent on salaries, and more elected officials to keep track of. Each state decides how it wants to handle this issue, but, generally, as the population of a state increases, so does the number of representatives it has. That rise is usually not linear. As the population increases, the number of representatives normally increases at a slower and slower rate until it stops altogether. This means more people being represented by a single legislator. We can look at the proportion of the number of people per representative to see how large an average district is within a state.

The writers of the U.S. The Constitution believed a ratio of 30,000 people per 1 representative was the proper balance for federal representation. Now, that ratio is over 25 times larger.  The United States was much more rural at its founding and so 30,000 people covered a much larger geographic area than now. Also, communication technology was much less advanced, so larger areas had less frequent communication than they do now. Taking those factors into consideration, what do you think of the current ratio for federal representation?  Is 30,000:1 still the proper balance for federal representation?  What about for state legislatures?

What other solutions do you think would help balance representation and the size of the legislature?

Data Source: https://ballotpedia.org/Population_represented_by_state_legislators

Reproduce the graph yourself or pick different states using the spreadsheet below.

Additional Resources

Representation in STEM Classes

Slow Reveal
Notice, Connect, Wonder

This data shows the demographic makeup of some of the STEM classes at Juneau-Douglas High School: Yadaa.at Kalé in Juneau, Alaska, for the school year 2017-2018.  It shows that the percentages of specific races/ethnicities in STEM classes are frequently very different from the percentages in the school as a whole. (Note, this table shows a few select classes.  The analysis below refers both to the data in this table and to the data from the complete table, which is available here.) More specifically, it is most frequently the white students who are overrepresented in the STEM classes and the other groups that are somewhat or very underrepresented; for instance, there are 0 Alaska Native students in calculus or engineering, even though they make up 15% of the school population.  Why is this like this and does it matter?  

It matters because anytime there’s a big discrepancy between school-wide and class-specific enrollment, it’s worth trying to understand why it’s happening and what potential consequences there might be.  The why is complex and some possibilities are suggested below. The consequences in this case are dramatic; taking STEM classes correlates with majoring in STEM subjects in college which is, in turn, necessary for most STEM occupations.  Currently, STEM occupations are generally both more highly paid than other occupations and less representative of the general population. That means that the work done in those fields does not benefit from a diversity of experience and point of view and so work is done “for” or “about” people by other people who do not have the relevant and necessary background (e.g., male engineers making products for females). Furthermore, the wealth of STEM fields is concentrated in certain groups (especially white men).  For example, as slide 18 shows, on the whole, white and Asian men in STEM jobs make considerably more than men of other races or women – so much so that Asian men are likely to make nearly twice as much as, for instance, Hispanic women.  

Some of the additional slides show the differential representation in STEM classes of other groups: male and female (no other identification of gender was available then), socioeconomic status (through free and reduced lunch), and of 9th grade math classes. At JDHS: Yadaa.at Kalé, females are generally overrepresented in the natural sciences and underrepresented in physical sciences, technology, and the highest level math courses. The greatest gender differences are in Principles of Engineering (5% female) and Intro to Health Sciences (91% female), which, not surprisingly, corresponds with the differences in which STEM occupational groups women are overrepresented (74% in health-related) or underrepresented (15% in engineering).  Free and Reduced Lunch representation is egregiously low or nonexistent throughout all but one STEM class (one year of Oceanography when it was a few percentage points higher than the general population).  And, there are also very sharp distinctions visible in the math preparation for different classes.  Enrolling in the STEM classes which are often a prerequisite for college STEM classes (Physics, Chemistry, upper level math, upper level biology) is highly correlated with having already completed algebra in 8th grade, prior to high school. (Remember, to see the complete data, go here.)

Why are white students so overrepresented in STEM classes and free and reduced lunch students so under enrolled?  There are no simple answers, but lots of pieces.  What level a student came to 9th grade is clearly indicative.  How is it that white students are so over represented in 8th grade algebra?  (slide 17)  They are also overrepresented in Gifted & Talented education – the testing for which is usually done in 3rd grade.  It’s been known for a long time that the testing for G&T is unfair, but no substantial changes have been made.  Participation in math classes is determined by teachers – and by some parents who may influence class assignments by paying for tutors and/or lobbying the administration for specific classes. In addition, some parents are able to pay for their children to take supplemental online courses to advance them along the math levels. Another factor is that math is often a class where homework is emphasized and where different families are more or less able to support their children with their homework. Students whose families do not have extra funds or are not themselves confident in math are at a disadvantage in being in more advanced math classes.

The data was culled from PowerSchool by the principal as part of that school’s Equity project. It was shared with the school teachers in a staff meeting and with the Juneau community through the local newspaper.  Data was also collected the following year for comparison’s sake (here). Because these classes are quite small, one student – especially from a marginalized group – can make a big difference in the data in the representation. For example, there’s not enough data to conclude that there’s a trend for black students to be more likely to take AP Statistics. Cumulatively, however, across classes, across marginalized groups, and over the two years, the pattern of underrepresentation is clear.) These data are certainly not unique to JDHS:Yadaa.at Kalé or to Juneau; we hear about similar patterns of underrepresentation of marginalized groups in certain classes throughout the US. 

Race, ethnicity and gender labels were taken from PowerSchool, which means that families chose those categories from the choices available.  Families could choose only one race category (Asian, Black, Multi-Ethnic, Alaska Native/American Indian, Hispanic or White).  Free and Reduced lunch data is also entered into PowerSchool, via the collection of paperwork required for Free and Reduced Lunch. Other demographic tags regarding special programs (English Learners, Extended Learning and Special Education) were not included, in part to allow for specific analysis regarding Race, Ethnicity, Gender and Socioeconomic patterns (if there were any). 

We want to be clear that these numbers do not reflect the inherent ability or potential of any individual students or of any group(s) of students. We know that it can be difficult, especially for the students from these underrepresented groups, to see this data and that there may be a range of emotions: sadness, anger, bravado, disbelief, etc.  We think that it’s important to share this data, talk about it, think about what factors have contributed to it, and work to make sure that these inequities do not continue into the future.

A very real danger in collecting and presenting data this way is that it might be incorrectly interpreted to say that, for instance, girls don’t enroll in Engineering because they’re not “good at” and “can’t do” Engineering.  That is simply untrue; both societal messages and actual practices and policies have created these disparities.  Another, contrasting, challenge is that students in the underrepresented groups may feel that the message of this data or this article is that they, as individuals, “have to” go into STEM fields – even if they don’t want to. That is also not the intention of this analysis.  Our point is that all students deserve the same opportunities to explore and learn so that they can make their own, independent, choices and we, as adults, have a tremendous responsibility to constantly be analyzing those opportunities and surrounding context to make them more and more equitable.  

What questions are you left with about the school data around you?

What other student/school data do you think students (and families) should be interacting with?

What other data could be gathered to understand and then address these unequal representations?

Slideshow and “reveal” analysis developed and written by Brenda Taylor, Juneau STEM Coalition, with some advising by Paula Casperson, JDHS: Yadaa.at Kale principal.

Additional Resources:

Visualization Type: Table

Data Source:

Visualization Source:

Triple Dip – Winter Forecasting

Slow Reveal
Notice, Wonder, Connect

“La Nina Triple Dip”  Seasonal Forecasts in Alaska, Winter 2022-23

Predicted SST anomalies (˚C) for January-March 2023 from the National Multi-Model Ensemble (NMME) of coupled atmosphere-ocean climate models. 

These two graphs show some of how and what NOAA predicts for 2022-2023 winter seasonal outlooks (climate) for precipitation and temperature. The first graph (of projected sea surface temperatures) are a major factor in generating the predictions for the second graph (of predicted temperatures on land.) Overall, the second graphs shows that it is more likely that it’ll be warmer than normal in Northern Alaska and the Aleutian chain and that it’s more likely that it’ll be colder than normal in South Central and Southeastern Alaska. Note, this does not mean this is what will happen for sure; these are predictions of likelihood.  Remember that:  “Climate is what you predict, weather is what actually happens.”  (National Centers for Environmental Information)

Nicholas Bond, a NOAA scientist, explains the creation of the first graph through the National Multi-Model Ensemble (NMME).  He writes, “an ensemble approach incorporating different models is particularly appropriate for seasonal and longer-term simulations; the NMME represents the average of eight climate models.  The uncertainties and errors in the predictions from any single climate model can be substantial.  More detail on the NMME, and projections of other variables, are available at the following website: http://www.cpc.ncep.noaa.gov/products/NMME/.”

According to National Weather Service climate researcher Brian Brettschneider, there are three main factors that scientists use in making long-term seasonal forecasts for Alaska:  

1) whether it’s a La Nina or El Nino, (or neutral) year 

2) the evolution of sea ice in the Chukchi and Bering Seas, and

3) long-term trends

La Nina

As the climate.gov staff explain, “El Niño and La Niña are opposite phases of a natural climate pattern across the tropical Pacific Ocean.”  El Nino is the warm phase, La Nina is the cool phase and there is a neutral phase as well in between the two when the temperatures and winds are closer to (long-term) averages.  Generally, each phase lasts about a year, though it’s not uncommon for La Nina to last 2 years (and, once, 33 months.)  During La Nina, in the tropical Pacific, surface winds are stronger and temperatures are cooler than average.  La Nina (and El Nino) years are often factors in more extreme weather conditions in the rest of the Pacific area.

It’s this pattern (yes, in the tropics!) that has the greatest impact on what kind of winter we’ll have here in Alaska.  What causes this climate pattern swing is not yet well understood, but the impacts of the swing around the earth are significant and are closely monitored and analyzed. This year, unusually, we are in a third year of a row of La Nina,  (For more information, look here.)  

Brettschneider describes the most likely effect of La Nina in Alaska:  “More times than not, La Niña winters are colder than average in Alaska. Not every time, but a majority of times. So that represents about 40% of the variability [in seasonal predictions].”  (APR)

Graph of seasonal ONI values

Seasonal (3-month) sea surface temperatures in the central tropical Pacific Ocean compared to the 1981-2010 average. Warming or cooling of at least 0.5˚Celsius above or below average near the International Dateline is one of the criteria used to monitor the El Niño-La Niña climate pattern. NOAA Climate.gov image, based on data from the Climate Prediction Center.  The Oceanic Niño Index (ONI) is NOAA’s primary indicator for monitoring the ocean part of the seasonal climate pattern called the El Niño-Southern Oscillation, or “ENSO” for short. (The atmospheric part is monitored with the Southern Oscillation Index.) (climate.gov)

Sea ice in the Chukchi Sea and the Bering Sea

Brettschneider points out that, “[The sea ice is] kind of getting a late start right now. And when that water is open with no ice on it, there’s a lot of heat that can be liberated into the atmosphere, and it keeps things warm.” (APR)

Trend

Brettschneider reminds us of what we all know: “The trend is warming. You know, if you just woke up from a coma, and someone said, ‘What do you think it’ll be? What do we think the winter will be like?’ You should probably say, ‘I don’t know, but it’s probably going to be warmer than winter used to be,’ just because things are warmer now.” (APR)

There are a variety of other factors that impact the actual (daily) weather we have that NOAA can’t use in seasonal predictions because they happen on short timescales.  Those short term factors are things like where the jet stream will be or what the trajectory of sea ice will be.

Why do these seasonal forecasts matter? As NOAA staff write, “Seasonal outlooks help communities prepare for what is likely to come in the months ahead and minimize weather’s impacts on lives and livelihoods. Resources such as drought.gov and climate.gov provide comprehensive tools to better understand and plan for climate-driven hazards. Empowering people with actionable forecasts, seasonal predictions and winter weather safety tips is key to NOAA’s effort to build a more Weather– and Climate-Ready Nation.”  (NOAA)

NOAA’s Climate Prediction Center updates the three-month outlook around the 15th of each month.  For the latest predictions, go to https://www.cpc.ncep.noaa.gov/products/predictions/long_range/

Additional Resources:

Visualization Type: Heatmap

Data Source:

Visualization Source:

Housing Shortage

Slow Reveal
Notice, Wonder, Connect

Titles suggested by students: “Alaska Housing Shortage”, “Make More Houses,” “Housing Crisis,” “No Workers = No Houses” or “The Housing Crisis We’re Facing,” “The Housing Problems of Alaska.”

Across Alaska, there’s a major housing shortage.

In Dillingham, teachers slept in their school earlier this year. In Southeast Alaska, businesses have lost workers because those workers can’t find housing. In Seward, the high school principal had to sleep in an RV by the ocean when he didn’t commute from Anchorage. In Girdwood, Alyeska Resort is building employee housing while in Ketchikan, a former state ferry serves the same purpose.

Last year, housing prices in Alaska hit a record high, with the average sale price of a single-family house topping $388,000. The average cost of a rental rose 8% this spring, to $1,276 per month, and rental prices in Anchorage rose 14%.” 

James Brooks, Alaska Beacon published by Alaska Public Media, Nov. 2, 2022

Most of Alaska is facing a housing crisis now: there’s not enough housing available and what is available is too expensive for many people. Why? In Juneau, summer of 2022, there was a theory circulating that the problem resulted in part from landlords converting their traditional, long-term rentals to “short-term rentals” (such as Airbnb) because those were more profitable. The City and Borough of Juneau Assembly asked Juneau Economic Development Council to some research and report back. This week’s graph shows what they found out: that conversion to STR’s is only one part of why there’s not enough housing. The larger factor is that while Juneau’s population has remained steady, the number of adults has increased (while the number of children has decreased) and the number of adults living alone has increased, and so more housing is needed for them. Additional graphs provide more context throughout Alaska and the U.S. While this graph is specific to Juneau, the lack of available and affordable housing is a huge problem throughout Alaska now, and looking at one community in detail can help us understand the complexity of the problem. What, if any, housing challenges do you see in your community?

For adults, one of the highest living expenses is housing. There are several common ways to attain housing: you can buy outright, buy through a loan, rent, or live with family or friends. 

If a buyer has a lot of money at their disposal, they can sometimes buy a house or apartment unit outright. 

However, most people don’t have enough money at their disposal to buy a house – for example, the median price of a house in Juneau was over $450,000 in 2021. This means that most people who buy a house borrow money from a bank for the down payment, and then make regular monthly payments (with interest) to pay off their loan; this can take up to 30 years. This loan is called a “mortgage”. If a borrower is not able to pay off their loan, the bank can take control of the house and kick the person out.

Thirdly, many people pay rent and do not own the unit that they live in. People who own housing units, called “landlords”, rent out their spaces to others at a certain rate. Typically, renters (called “tenants”) pay a monthly fee to continue living in the apartment/home/unit.  Sometimes that fee includes utilities such as electricity or heat, other times it doesn’t.  The “average adjusted rental price” is determined by adjusting all rental contracts to include utility costs to make comparisons more valid.

Within a community, the ability to find housing has a large economic impact. Because we live in a capitalist society, housing is viewed as a commodity (something that can be bought and sold) that landlords & real estate investors can use to make a profit: supply and demand tend to dictate the availability and prices of housing units, similar to gas prices going up when there is less oil being imported into the United States. When demand for housing outpaces the local supply, housing prices go up and many low-income individuals and families are either severely cost-burdened by housing prices or are unable to afford them at all. This leads to more people leaving Juneau, employers having difficulty attracting people to fill jobs, and people having less disposable income to spend – which then has a negative impact on the economy as a whole.

Juneau’s low vacancy rate and high average rental price: Juneau’s 2022 vacancy rate (all rental units) was 3.6%. That means that out of every 1000 rental units in Juneau, only 36 are actually available for additional renters. Such a low vacancy rate shows us that Juneau is facing a crisis of affordable housing – most economic research agrees that a vacancy rate of 6-8% is ideal to keep rental prices balanced and affordable. Juneau’s average rental price for an apartment in 2022 was $1,260 per month ($15,120 per year). For someone earning Alaska’s minimum wage of $10.34, this constitutes 70% of their yearly pre-tax income, over two-thirds, which is a huge cost burden. It would leave them with only about $6,387 to spend on all other items: federal income tax, food, medicine, entertainment, car payments, maintenance, etc.  It’s commonly agreed that 30% of wages is a reasonable percentage to spend on housing.  The “Housing Wage” in Juneau – to afford the average rental price – would be $24.23/hr (about $50,4000/year)

The graph shows that between 2010 and 2020, there were 1,420 housing units built, 435 units converted to short-term rentals, and 173 units demolished. Short-term rentals (STR) – such as B&B’s or AirBnB’s – are set up for tourists and others who only want to live in Juneau for a short period of time (like, for instance, legislators). Even when owners of STR’s agree to rent for a longer period of time (a year), they charge at the more expensive, short-term rates.  STR’s, therefore, are not useful or affordable housing for Juneau residents. Within those ten years,  there were 812 net units added. Within the same time span, Juneau’s adult population increased by 1,435 people.

In 2021, the average number of people per housing unit was 2.45 in Juneau. This means that, theoretically, 812 units should or could be enough to accommodate 1,989 new people (812 x 2.45) – but clearly, due to continually rising prices, very low vacancy rates, and, yes, considerable anecdotal evidence, there isn’t enough housing in Juneau, and new units need to be built to lower prices and allow more people to buy and rent housing units.  While, theoretically those 812 units “should” be enough to accommodate the additional needs, it’s very likely that there are not 812 units actually available to those 1989 people. The data does not account well for all the housing units that seem to be available, but actually are not.  For instance, some units may be used as vacation units, others may be occupied by short-term tenants such as legislators and seasonal workers) that are not on the main STR websites (e.g., AirBnB). In addition, demolished/decrepit units are undercounted because there isn’t a consistent city system to account for them.  

What factors could be creating this crisis in Juneau’s housing market?  (see additional graphs in the slides for supporting evidence)

  • The adult population has grown more quickly than other parts of the population, and adults are the age group most likely to need housing. 
  • Juneau has an “aging in place” population, meaning there are many seniors who occupy more housing space than in previous years (when seniors would have moved to assisted living homes or out of state).
  • The increasing number of seniors living alone is a driving factor behind the declining average household size, which contributes to the problem of needing more housing units for the same number of people.  
  • People’s living arrangements in general continue to change, with more people living alone in Juneau than in previous generations.
  • A partial factor, as noted, is the conversion of units to short-term rentals whether for workers or tourists.
  • Inadequate data as described above. We don’t have the systems in place to accurately measure how much housing stock is or is not available and so it’s been hard to plan.
  • Inflation is a factor in the price increase.  Specifically, the cost of building materials has gone up sharply.
  • As noted above, we live in a capitalist economy and supply and demand drive prices up and down.  When supplies (of housing) go down, the sellers (landlords) charge more because they know buyers (renters buyers of houses) will pay more.

What are other factors influencing the housing crisis in the rest of Alaska?  In addition to the variables at play in Juneau, some communities have additional issues.  

  • Many communities off the road system, for instance, have an especially difficult time creating new housing stock because of 1) the short construction season and 2) the fact that barges with construction materials only arrive twice a year.  (Alaska Public Media)

What can be done to reverse the lack of affordable housing in Juneau and throughout Alaska?

  • Subsidized housing (the government pays part of the rent and/or pays for part of the construction of new housing)
  • Employers build housing for employees
  • Creative solutions in which seniors rent out their extra space/bedrooms to adults needing housing in return for assistance around the house
  • Open up more land for building (e.g., rezoning.)
  • Make local lumber more accessible for local building
  • Tax incentives and grants to encourage and support more construction, particularly higher density units and affordable housing for workers.

Another way to look at housing is from a community level re: climate change and minimizing carbon footprint. The NYTimes describes how Dr. Chris Jones “in earlier research, [….] has shown that for many cities, such as Berkeley, Calif., the single most effective climate strategy local leaders can pursue is to add what’s known as infill housing, apartments or townhouses built in underutilized parts of cities to reduce car dependence and improve energy efficiency.”

Additional Resources:

Graphs and analysis posted by Brenda Taylor, with expert input and advice from Anton Rieselbach, JEDC Researcher.

Visualization Type: Bar Graph

Data Source:

Visualization Source:

Daylight

Slow Reveal
Notice, Wonder, Connect

 Student Suggestions for Catchy Headlines: “The Lights of Nome,” “Dwindling Nightlight?,” and “Nome Your Time (Know Your Time).”

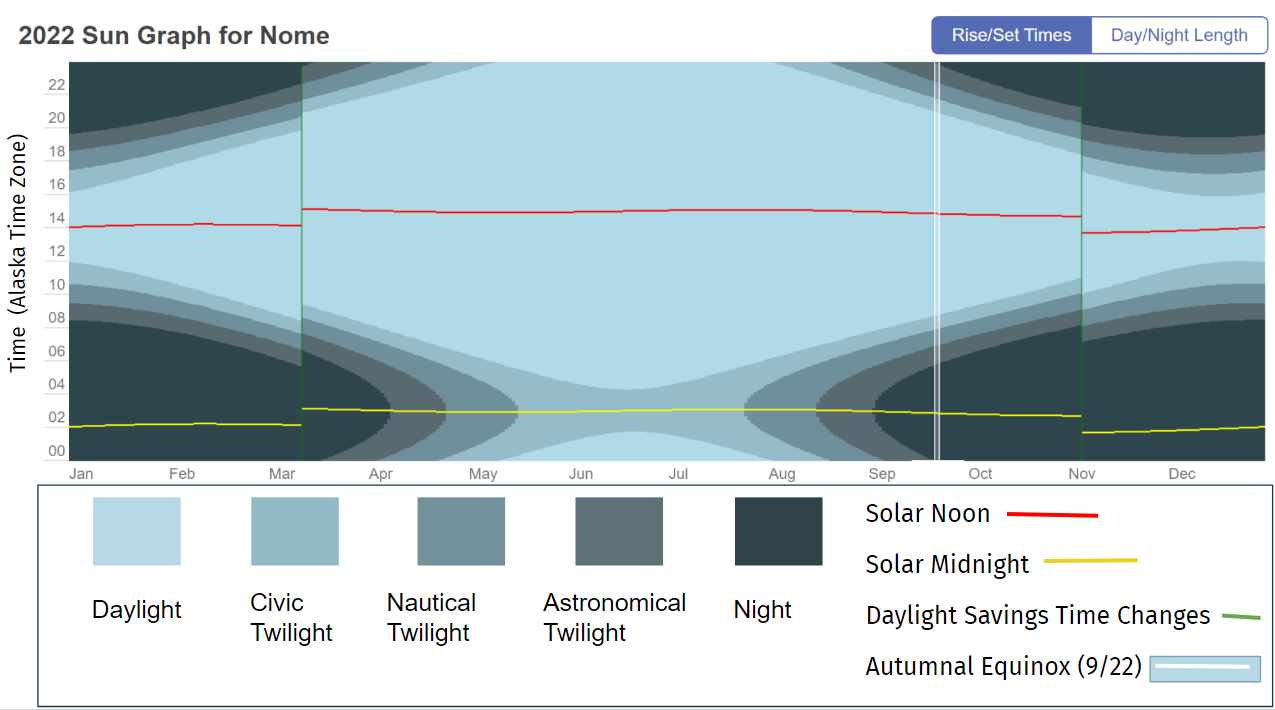
TimeandDate.com makes sun graphs of any location in the world. These graphs show the length and time of daylight, twilight and night over the course of 2022. We focus on Nome, Alaska, as a location to the north of the state and to the west within the Alaska Time Zone. How does light change over the year? How do we humans adjust our clocks to shape our connections with the natural world and with each other?

This sun graph depicts daylight, twilight, and night throughout 2022 for Nome, Alaska, using a 24 hour clock to show local times, not am and pm.  The graph shows how skewed Nome’s clock time is from its solar time.  Solar noon in Nome – when the sun is highest in the sky – happens at 14:00 (2:00 pm) in the winter and at 15:00 (3:00 pm) in the summer.  Similarly, the darkest part of the night is at 2:00 or 3:00 in the morning, not at midnight.  

The graph differentiates among the different types of twilight (specific definitions are in the slide deck). From mid-May through mid-August, the darkest that it gets in Nome is “Civic Twilight” when there is “still enough natural sunlight … that artificial light may not be required to carry out outdoor activities.” The graph also shows how switching over to Daylight Savings Time (in March) and back to Standard time (in November) shifts clock time an hour later and then earlier.  

We chose Nome as the main graph because it’s close to the western limit of the Alaska Time Zone (-9 UTC) and so its solar time is particularly skewed.  This additional slide shows how sun graphs differ within the Alaska Time Zone at 5 different locations in Alaska, and, for further comparison, Disneyland in California is included. 

In looking at these sun graphs simultaneously, we can see that in Unalaska – which is about as far west as Nome – the solar time is equally skewed, but, because it’s further south, they experience astronomical twilight there in the summer months, when it’s dark enough for most celestial objects to be viewed.  By contrast, Hyder, to the far east of ADT, experiences solar noon a little early (11:30 am) in the winter and a little late (12:30 pm).  (Of course, variation within the hour before and after solar noon is to be expected.) Utqiagvik is in the most northern part of Alaska and its sun graph reflects that – no twilight at all in the summer months and no daylight at all in the winter months.  However, Utqiagvik is not as far west as Nome, and its solar noon is less “off” (about 1:00 pm in the winter and 2:00 pm in the summer). The sun graphs of Juneau and Fairbanks reflect their respective locations.  Disneyland, far to the south and closer to the equator, experiences much less variation in the amount of daylight each day and much shorter periods of twilight (note: it’s also in a different time zone).

Time zones were initially figured out mathematically (by dividing the earth into 24 zones, one for each hour of the day, beginning in Greenwich, England, and then radiating out along longitudinal lines).  They were then significantly adjusted to accommodate political boundaries and geographic landmarks.  Since then, individual political entities (e.g., countries, states, and/or provinces) have been deciding for themselves how and where they want to adopt those time zones and during which part(s) of the year, for their particular boundaries. (Fig.2)  Each time zone is described by how it relates (+ or -) to UTC (Universal Time Coordinated).  Greenwich, England is 0 UTC.  

The contiguous US spans 4 time zones – Eastern (-5 UTC), Central (-6 UTC), Mountain (-7 UTC), and Pacific (-8 UTC).  Alaska, given that it is as wide as the contiguous US, also spans the equivalent of 4 time zones. Until as recently as 1983, all 4 time zones were used within Alaska as shown (more or less) in the diagram below  Now, all of Alaska is either in Alaska Time (-9 UTC) or Hawaii-Aleutian Time (-10 UTC).  The dividing line between time zones within Alaska is just west of Unalaska.  

Deciding how to adapt clock time across broad geographic distances has been a complicated and often heated discussion for more than a century at many levels. For many years, each community set its own clocks according to the sun. 

“In North America, a coalition of businessmen and scientists decided on time zones, and in 1883, U.S. and Canadian railroads adopted four (Eastern, Central, Mountain and Pacific) to streamline service. The shift was not universally well received. Evangelical Christians were among the strongest opponents, arguing “time came from God and railroads were not to mess with it,”…” (NYTimes)

Similarly, discussions about Standard vs Daylight Savings Time – whether to switch and, if so, which to keep  permanent – have raged for decades in the US and elsewhere.  

“To farmers, daylight saving time is a disruptive schedule foisted on them by the federal government; a popular myth even blamed them for its existence. To some parents, it’s a nuisance that can throw bedtime into chaos. To the people who run golf courses, gas stations and many retail businesses, it’s great.” (NYTimes)

Most recently, the U.S. Senate voted, in the spring of 2022, to stay on Daylight Savings Time permanently.  That bill is currently stalled in the U.S. House.  Both Alaska senators voted to make Daylight Savings Time permanent.  

In Alaska, the challenges have revolved around how the choice of time zones might unify Alaska, force distant communities to adhere to clock times that adversely affect their daily lives, and/or might further connect or disconnect Alaska from the US West Coast, where much business has centered. During WWII, “Southeast Alaska was put on Pacific Time during World War II to synchronize the state capital with San Francisco and Seattle.” In 1983, when Alaska switched from 4 time zones to 2, some communities chose to stay on Pacific Time to be aligned with the banks and businesses in Seattle (Ketchikan) and to be aligned with the Bureau of Indian Affairs in Portland (Metlakatla). They have since switched over to Alaska Time. 

Elsewhere, China, a country even wider than the state of Alaska and spanning 5 time zones, has chosen to keep the entire country on Beijing time since 1949. The Yukon Territory, in 2020, decided to stop switching from daylight to standard time.  They are now permanently at -7 UTC.  That means that in the summer, they are one hour ahead of Alaska (i.e., they are aligned with Pacific Daylight Time) and in the winter, they are two hours ahead of Alaska (i.e., they are aligned with Mountain Standard Time)

What do you think?  

  • How do daylight hours in Nome align similarly or differently from where you are?  Why?  
  • How does Daylight Savings Time (March-November) impact you, if at all?
  • Would you rather more daylight in the morning year-round (that’d be Standard Time, like now, late November) or would you prefer more daylight in the afternoon/evening year-round (that’d be Daylight Savings Time, like in summer and early fall)?
  • If you were to choose either Daylight Savings Time or Standard Time to make permanent for the entire country, which would you choose and why?  Who might have a different preference and why?
  • If you were in charge of Time Zones for Alaska, how many would you choose?  Which ones?    
  • Or, should we have Time Zones at all?  Are there alternatives?

There’s lots of fascinating history behind the creation of and disagreements around Time Zones and Daylight Savings Time at world, national and state levels.  We’ve included several very readable articles in resources; check them out.

Finally, one more note that may clear up some questions: 

The Prime Meridian (0°longitude) and the Ante Meridian (180°longitude) “divide” the earth into the western and eastern hemispheres.  Most of Alaska is east of the 180th meridian, but parts (e.g., Attu) are west of the 180th meridian; that means that Alaska is the state that is, technically (mathematically), both farthest west and farthest east! The International Date Line runs roughly along the 180th meridian, but because it’s a political construct, people have adjusted it to run west of (rather than through) Alaska and so all of Alaska (and the US) remain in the same date. 

Additional Resources:

Visualization Type: Area Graph

Data Source: Time and Date

Visualization Source: Time and Date

It can easily be replicated. Go to the Time and Date and select the place that you want the sun graph of.

Exercise Heatmap

Notice, Wonder, Connect Juneau
Notice, Wonder, Connect Fairbanks

Strava, one of the most popular exercise apps, has a heatmap of all exercise done over the past year. It shows where people are recording workouts and the paths they are taking. You can also filter by activity type to see the differences between biking, running, winter, and water activities.

Physical activity is happening every day all around you. From biking to school or work to walking downtown to skiing at the slopes to swimming on a lake, we are moving around for fun, exercise, and jobs. All of this activity is not evenly distributed though. Many people use the Strava app to record their exercise so that they can compare their activity over time. Strava users have the option to make their data visible to anyone or just to select friend groups. Strava uses the public data to create these heatmaps so everyone can find trends.

Who do you think might use these heat maps and why?

Strava puts each activity into one of four activity types. When users click on their recording devices, they mark what type of activity they’ve done. Strava uses complicated algorithms to screen/filter out data that they think doesn’t fit. For example they remove data that appears too fast for a specific activity. What are the advantages and disadvantages of this filtering?

  • Ride: Ride, Handcycle, Wheelchair, Velomobile, E-Bike Ride, Mountain Bike Ride, Gravel Bike Ride, E-Mountain Bike Ride, Skateboard
  • Run: Run, Walk, Hike, Rock Climbing, Trail Run
  • Water: Swim, Kitesurf, Windsurf, Kayaking, Rowing, Stand Up Paddling, Surfing, Canoeing, Sailing
  • Winter: Alpine Ski, Ice Skate, Backcountry Ski, Nordic Ski, Snowboard, Snowshoe, Winter Sport

Look at the map and see how usage varies by these activity types. What trends can you find? Can you identify any local landmarks by comparing the popularity of different activity types? In some cases, this will depend on your climate.

If we look at Juneau, we can clearly see a spike of winter activity at Eaglecrest Ski Area.

Figure 2. Strava Juneau Winter Activities Heatmap

However, Fairbanks with its colder climate has a much more dispersed winter activities.

Figure 3. Strava Fairbanks Winter Activities Heatmap

If we look at water activities, we can find similar patterns

Figure 4. Strava Juneau Water Activities Heatmap
Figure 5. Strava Fairbanks Water Activities Heatmap

Both Juneau and Fairbanks see a spike of water activities around docks and other launch sites. In Juneau this corresponds to North Douglas Launch Ramp, Auke Lake, and most noticeably Mendenhall Lake (a popular tourist destination). For Fairbanks, Chena River Lakes Recreation Area launch sites (in the east side), Tanana Lakes Recreation Area launch sites (in the south central side), and launch sites along the Chena River are major spots.

The Strava Heatmap is composed of public data collected from Strava users’ recorded workouts from the past year. Currently over 100 million people use Strava. Are these people an accurate representation of the average person? What groups do you think are over or under-represented? What about these workouts? Do you think everyone records all the activities they do? What types are more likely to be recorded and made public? This might be useful data for trail planners trying to determine which routes to focus on. Meanwhile, city planners might find the data overrepresenting certain ethnicities and therefore not accurate enough for determining where to put bike lanes. Only using data from the past year presents another conundrum. On one hand, old roads or former trails will disappear from view more quickly, allowing them to recover from overuse. Routes that change seasonally are also impacted. Do you know of any trails in your community that might disappear on the heatmap because of this?

For a point to appear on the graph, multiple people have to have walked along it. The brightness is then determined by how many people used that path compared to other nearby routes. The colors are then distorted to make them more evenly distributed. This magnifies small differences. What this means is that what is really bright in one location is not equivalent in popularity to really bright in a different area. It also means that something twice as bright is not necessarily twice as popular. Strava chose this methodology to provide a more visually appealing image. What do you think about this choice? While the picture may look nicer, someone who has not read the details might think a trail is more popular than it is.

What are some of the consequences of having all of this data available? Some people use this to find new trails close to their home or when they visit someplace new. The danger is that they might not have properly researched a route and go in unprepared, especially if that route is seasonally dependent. For example, some years Mendenhall Lake in Juneau freezes over and can be walked across safely. Someone unfamiliar with the lake might assume it is always safe to cross and end up falling into it and getting hypothermia. It can also lead to more people following a path they see on Strava that is not an official trail. Over time this can greatly degrade the route and cause harm to the environment.

Online publicly available user data can often cause unintentional harm. For example, several years ago, Strava heat maps were used to identify foreign military bases and common patrol routes. Furthermore, even though Strava anonymized their data, individuals were able to connect it with other Strava and outside data sources to figure out who the people running these routes were, where they lived, and what other locations they frequented. Obviously this poses a huge security and privacy risk for both the military and the individuals. How do we balance freedom of information with the safety concerns of this information? Published speed records like what Strava has for their routes can encourage risky behavior. On particularly dangerous routes, runners are incentivized to perform risky moves in order to save on time. Not only does this risk their health, but it also can force emergency services to go into dangerous conditions to rescue them.

Additional Resources:

Visualization Type: Heatmap

Data Source: Strava Data (proprietary)

Visualization Source: Strava Global Heatmap

It can easily be replicated. Go to the Strava Heatmap, select the activity type you want to see, and zoom into the area you want to see.

Social Connectedness in America

Slow Reveal
Notice, Wonder, Connect

What do these maps show?

Both maps show equally strong connectedness from their respective communities to the rest of Alaska (with the exception of Kusilvak, which is more closely connected to Fairbanks than to Juneau).  Fairbanks, though, is much more broadly connected to the lower 48 states than Juneau is (the colors are more evenly diffused throughout the US in the Fairbanks map than in the Juneau map.)  

Juneau is more closely connected to Hawaii than Fairbanks is. What might account for that? (Perhaps Juneau residents have more money to vacation with?  Juneau residents have lived in AK longer and are more desperate for sun?  Juneau is cloudier and rainier than Fairbanks and so its residents are more eager to leave?  Fairbanks residents from the Air Force Base are more likely to have connections with their families and friends from “home” than with Hawaii.

In the lower 48, Juneau is most closely connected socially with the Northwest corner of the U.S. – Washington, Oregon, Idaho, Northern Nevada and Western Montana.  That makes sense because those are the areas of the US that are geographically closest to Alaska so Alaskans would be likely to have friends and other connections there.  Juneau’s closest connectivity stops more or less at the Rocky Mountains, with the exception of largish areas of connectivity in some Northern parts of the U.S. which have similar physical environments to Juneau.  

Most likely, Fairbanks is more broadly connected throughout the US because of Eielson Air Force Base which accounts for more than 9000 people (2,981 Active Duty, 2,628 family members, 1,682 civilians & contractors, 77 tenant units, and 2,391 retirees), nearly 1/10 of Fairbanks North Star Borough.  Military personnel come from and stay connected to all parts of the US. Eielson AFB | Base Overview & Info | MilitaryINSTALLATIONS

Background information

“County equivalents”

The relative size of Alaska compared to the rest of the U.S. is misleading in these graphs (as it is in so many representations of the US). In fact, Alaska is larger than Texas, California and Montana combined.

These maps are set up to compare counties within and across states. However, two states – Alaska and Louisiana – do not have counties. For purposes of comparison, “county-equivalents” are used.  In Louisiana, those are “parishes; in Alaska, organized boroughs and census areas are used. At first glance of the maps, it looks as if the county equivalents in Alaska are of comparable size (or even smaller) than counties in many other western US states.  In actuality, nine of the geographically largest county or county-equivalents in the U.S. are in Alaska (San Bernardino in CA is #10). County statistics of the United States – Wikipedia The Yukon-Koyukuk census area is the largest county equivalent in the entire U.S. and is slightly larger in size than the state of Montana. All of that means that there’s not as much geographical nuance in this visualization within Alaska as within other states.  

In writing the constitution of Alaska, the founders intentionally did not recreate the county government layer of the lower 48 states and decided, instead, to enable residents to choose whether to create organized boroughs – or not. These borough structures continue to evolve.  Currently, in Alaska, there are six city-boroughs, 13 organized boroughs, and one unorganized borough. The largest organized borough is the North Slope, which contains 94,000 square miles, enough land so that if it were set off by itself, the North Slope Borough would be the 12th largest state in the nation. The unorganized borough, which accounts for 57% of the land in Alaska, is larger than any other single US state. For the purposes of data collecting and analyzing, the US Census Bureau and the state of Alaska, delineate the unorganized borough into 11 census areas. It is these 30 county equivalents – 19 organized boroughs and 11 census areas – that are used to organize and analyze this data. https://web.archive.org/web/20211105013431/https://www.akhistorycourse.org/governing-alaska/local-government/

What do we know about how representative Facebook data may be?

  • The percentage of adults in the US who use Facebook has remained close to 70% since 2016
  • Women (77%) are more likely than men (61%) to use Facebook
  • Adults over 65 are the least likely (50%) adult age group to use Facebook
  • Slightly more than half of teens report using facebook in 2021, down from 71% in 2015

More specifically, how did this study use Facebook data?

  • Facebook users who were included were only those who had used Facebook within the past 30 days.   (Appendix)

Questions to consider:  

  • What might be the benefits of having (many) geographically distant Facebook friendships?
  • What might be the benefits of having (many) geographically close Facebook friendships?

Below are some additional graphs from this study and some analysis from the New York Times.  What do you think?

“Close-knit communities can have their own benefits, like enabling neighbors to rely on one another for economic and social support. But previous research suggests that “weak ties” to people we know less well can be particularly valuable for bringing us information we don’t already have. So people in communities that are more broadly connected may be more likely to hear about a wider range of business or educational opportunities.

The patterns in this Facebook data don’t necessarily mean that limited social networks cause worse economic and health outcomes, or that wide-ranging networks produce better ones. But other researchers say this data will make it possible in future studies to untangle why they’re related.

“This gives us the first way to systematically look at some of those relationships,” said Mark Granovetter, a sociologist at Stanford who has written influential papers on the value of social networks. “They have just scratched the surface here.””  https://www.nytimes.com/interactive/2018/09/19/upshot/facebook-county-friendships.html

Visualization Type: Choropleth Map

Data Source: Social Connectedness: Measurement, Determinants, and Effects

Visualization Source: How Connected Is Your Community to Everywhere Else in America?, NYTimes

It can easily be replicated. Go to the NYTimes article and select the community you want to see.

Subsistence Harvesting

Slow Reveal
Notice, Wonder, Connect

(So many great) Student Suggestions for Catchy Headlines: “The Pie Food,” “Alaska’s Meat Pie Charts,” “Animals That Die the Most,” “Wild Foods We Use,” “The Harvesting of Two Places,” “The Harvests of Alaska,” “Surf and Turf in Alaska,” and “Alaska’s Different Diets.”

These graphs show the subsistence harvest of two villages in Alaska based on household samples conducted by the Alaska Department of Fish and Game, Subsistence Division. Harvest is converted to pounds for consistency in comparison.

Subsistence harvesting is a crucial way of life for many Alaskan Natives. Alaska state law and federal law define subsistence uses as the “customary and traditional” uses of wild resources for various uses including food, shelter, fuel, clothing, tools, transportation, handicrafts, sharing, barter, and customary trade. To determine if a resource is associated with subsistence, there are eight criteria Alaska Department of Fish and Game look at. They are: length and consistency of use; seasonality; methods and means of harvest; geographic areas; means of handling, preparing, preserving, and storing; intergenerational transmission of knowledge, skills, values, and lore; distribution and exchange; diversity of resources in an area; economic, cultural, social, and nutritional elements.

Angoon and Kobuk both display a large amount of subsistence harvesting. Angoon displays a much broader diversity of food then Kobuk. Kobuk, however, has a much larger amount of harvesting per person. Interestingly, both communities do the majority of their harvesting of fish (many different types), but their largest single resources are land mammals (deer in Angoon and caribou in Kobuk). There is virtually no overlap in what resources they are collecting though. This is due to the vastly different climate Angoon has in the Southeast compared to Kobuk in the Interior.

There were lots of questions from students about the range of animals, especially caribou and deer, so we’re adding some maps below and a website for you to research more animals.

All of these graphs are from the Alaska Department of Fish and Game. Go to https://www.adfg.alaska.gov/index.cfm?adfg=animals.listall to find the ranges for all animals in Alaska.

Another student noticed that there was more chum salmon harvested in Kobuk than in Angoon. We asked Flynn Casey, who works at ADFG, for more insight on that and he said:

“To start with a simple answer, chum salmon do appear in the Angoon harvest data…. The number for chum is 1.3 pounds per capita. …[A]ny resource that clocks in under 2 pounds per capita gets binned into the ‘other’ category….

It’s also important to remember that the data represents this snapshot in time which could be an outlier in some way(s). For example, 2012 seems to be a year of relatively weak salmon returns compared to prior years during which subsistence harvest data was collected, both for Angoon and Kobuk…. 

While there are probably several factors relating to that big difference in chum harvest, a little scanning of the relevant tech papers (399 for Angoon; 402 for Kobuk) suggests that it is largely driven by how much each community targets chum salmon compared to other salmon species. Chum are the only species of salmon to be found in significant quantity near Kobuk (notice no other salmon species shows up in the Kobuk pie chart), so it’s a highly targeted fish. For Angoon, much of the 2012 subsistence fishing effort targeted coho and Chinook salmon, either by trolling or rod-and-reel, in coastal waters. The remaining salmon species can be caught among the same few systems of inside protected waters, but most of the effort there was for sockeye salmon.

*Another interesting factoid from the Kobuk paper: while similar weights of caribou and chum salmon were harvested in 2012… “Many respondents reported that they were not able to adequately dry much of the salmon they harvested because of incessant rain. As a result, households fed spoiled salmon to dogs in order to avoid wasting the resource.””

Finally, several students said they were surprised that there was so much caribou harvested in Kobuk and so little moose, especially because that’s so different from hunting around Fairbanks. They wondered what the graph of Fairbanks would look like. We highly recommend that you look at information below about making a graph about your own community. Email us at juneaustemcoalition@gmail.com with questions – or with your completed graphs. We’d love to add them to this post!

Additional Resources:

Visualization Type: Pie Chart

Data Source: Community Subsistence Information System, Alaska Department of Fish and Game, Subsistence

Visualization Source: Craig Fox using Microsoft Excel.

It can be replicated with medium effort and medium technical skill. First determine if the communities you want to use have data by checking the Community Observer Interactive Map of Geographic Survey Data. Only use communities with comprehensive data. For comparison purposes try to only use one village and compare over time, or compare multiple villages in the same year. Once you identify the communities and years you want to use, go to the Community Subsistence Information System. Select “Harvest by Community”, then select the community you would like to view. Select which year you want under “Project Years Available”. Check the box that says “Include Only Primary Species in Download”. Then click “Create Excel File”. Repeat this process for each community or year you want to use. Next download the file below called “Subsistence Harvesting Make Your Own”. Replace the data on the sheet called “Replace with Downloaded Data” with the data you got from the Community Subsistence Information System. Then go to the “Pivot Chart and Graph” tab. Click somewhere on the chart. On the ribbon at the top, a new option called “PivotTable Analyze” will appear. Select that and then click “Refresh”. The graph will now display the data. Change the title of the graph and update the colors. Repeat this process for each graph you want.