
Slow Reveal
Notice, Connect, Wonder
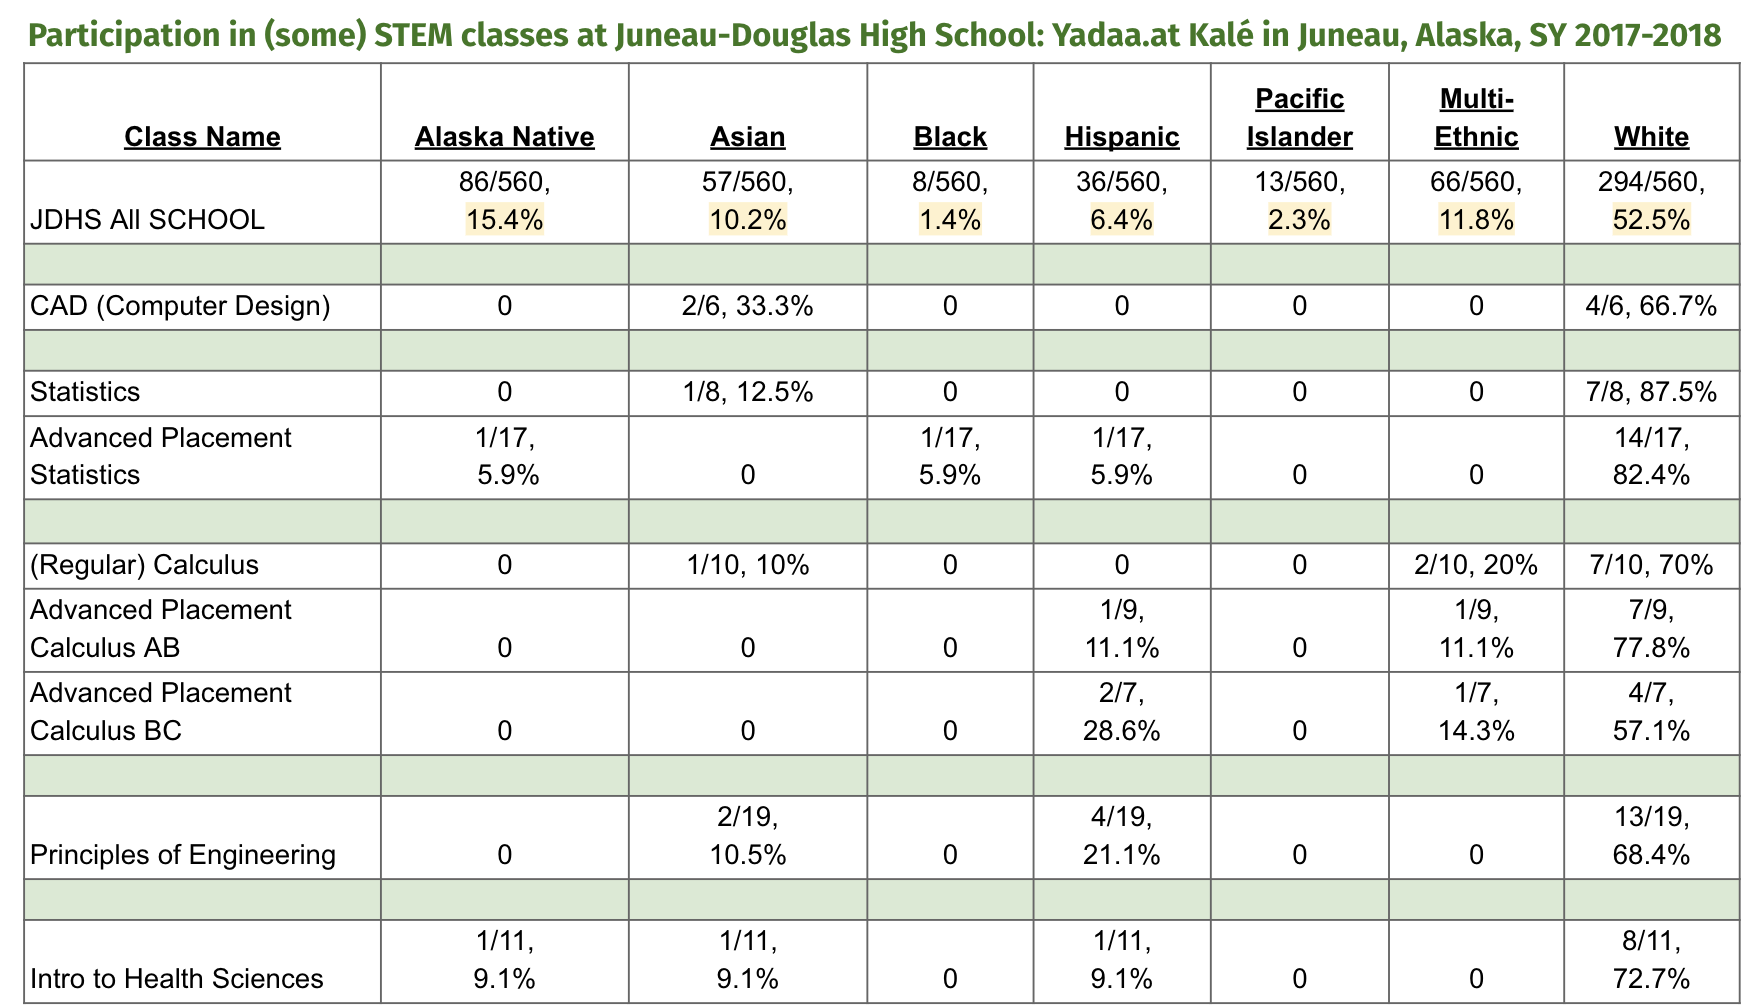
This data shows the demographic makeup of some of the STEM classes at Juneau-Douglas High School: Yadaa.at Kalé in Juneau, Alaska, for the school year 2017-2018. It shows that the percentages of specific races/ethnicities in STEM classes are frequently very different from the percentages in the school as a whole. (Note, this table shows a few select classes. The analysis below refers both to the data in this table and to the data from the complete table, which is available here.) More specifically, it is most frequently the white students who are overrepresented in the STEM classes and the other groups that are somewhat or very underrepresented; for instance, there are 0 Alaska Native students in calculus or engineering, even though they make up 15% of the school population. Why is this like this and does it matter?
It matters because anytime there’s a big discrepancy between school-wide and class-specific enrollment, it’s worth trying to understand why it’s happening and what potential consequences there might be. The why is complex and some possibilities are suggested below. The consequences in this case are dramatic; taking STEM classes correlates with majoring in STEM subjects in college which is, in turn, necessary for most STEM occupations. Currently, STEM occupations are generally both more highly paid than other occupations and less representative of the general population. That means that the work done in those fields does not benefit from a diversity of experience and point of view and so work is done “for” or “about” people by other people who do not have the relevant and necessary background (e.g., male engineers making products for females). Furthermore, the wealth of STEM fields is concentrated in certain groups (especially white men). For example, as slide 18 shows, on the whole, white and Asian men in STEM jobs make considerably more than men of other races or women – so much so that Asian men are likely to make nearly twice as much as, for instance, Hispanic women.
Some of the additional slides show the differential representation in STEM classes of other groups: male and female (no other identification of gender was available then), socioeconomic status (through free and reduced lunch), and of 9th grade math classes. At JDHS: Yadaa.at Kalé, females are generally overrepresented in the natural sciences and underrepresented in physical sciences, technology, and the highest level math courses. The greatest gender differences are in Principles of Engineering (5% female) and Intro to Health Sciences (91% female), which, not surprisingly, corresponds with the differences in which STEM occupational groups women are overrepresented (74% in health-related) or underrepresented (15% in engineering). Free and Reduced Lunch representation is egregiously low or nonexistent throughout all but one STEM class (one year of Oceanography when it was a few percentage points higher than the general population). And, there are also very sharp distinctions visible in the math preparation for different classes. Enrolling in the STEM classes which are often a prerequisite for college STEM classes (Physics, Chemistry, upper level math, upper level biology) is highly correlated with having already completed algebra in 8th grade, prior to high school. (Remember, to see the complete data, go here.)
Why are white students so overrepresented in STEM classes and free and reduced lunch students so under enrolled? There are no simple answers, but lots of pieces. What level a student came to 9th grade is clearly indicative. How is it that white students are so over represented in 8th grade algebra? (slide 17) They are also overrepresented in Gifted & Talented education – the testing for which is usually done in 3rd grade. It’s been known for a long time that the testing for G&T is unfair, but no substantial changes have been made. Participation in math classes is determined by teachers – and by some parents who may influence class assignments by paying for tutors and/or lobbying the administration for specific classes. In addition, some parents are able to pay for their children to take supplemental online courses to advance them along the math levels. Another factor is that math is often a class where homework is emphasized and where different families are more or less able to support their children with their homework. Students whose families do not have extra funds or are not themselves confident in math are at a disadvantage in being in more advanced math classes.
The data was culled from PowerSchool by the principal as part of that school’s Equity project. It was shared with the school teachers in a staff meeting and with the Juneau community through the local newspaper. Data was also collected the following year for comparison’s sake (here). Because these classes are quite small, one student – especially from a marginalized group – can make a big difference in the data in the representation. For example, there’s not enough data to conclude that there’s a trend for black students to be more likely to take AP Statistics. Cumulatively, however, across classes, across marginalized groups, and over the two years, the pattern of underrepresentation is clear.) These data are certainly not unique to JDHS:Yadaa.at Kalé or to Juneau; we hear about similar patterns of underrepresentation of marginalized groups in certain classes throughout the US.
Race, ethnicity and gender labels were taken from PowerSchool, which means that families chose those categories from the choices available. Families could choose only one race category (Asian, Black, Multi-Ethnic, Alaska Native/American Indian, Hispanic or White). Free and Reduced lunch data is also entered into PowerSchool, via the collection of paperwork required for Free and Reduced Lunch. Other demographic tags regarding special programs (English Learners, Extended Learning and Special Education) were not included, in part to allow for specific analysis regarding Race, Ethnicity, Gender and Socioeconomic patterns (if there were any).
We want to be clear that these numbers do not reflect the inherent ability or potential of any individual students or of any group(s) of students. We know that it can be difficult, especially for the students from these underrepresented groups, to see this data and that there may be a range of emotions: sadness, anger, bravado, disbelief, etc. We think that it’s important to share this data, talk about it, think about what factors have contributed to it, and work to make sure that these inequities do not continue into the future.
A very real danger in collecting and presenting data this way is that it might be incorrectly interpreted to say that, for instance, girls don’t enroll in Engineering because they’re not “good at” and “can’t do” Engineering. That is simply untrue; both societal messages and actual practices and policies have created these disparities. Another, contrasting, challenge is that students in the underrepresented groups may feel that the message of this data or this article is that they, as individuals, “have to” go into STEM fields – even if they don’t want to. That is also not the intention of this analysis. Our point is that all students deserve the same opportunities to explore and learn so that they can make their own, independent, choices and we, as adults, have a tremendous responsibility to constantly be analyzing those opportunities and surrounding context to make them more and more equitable.
What questions are you left with about the school data around you?
What other student/school data do you think students (and families) should be interacting with?
What other data could be gathered to understand and then address these unequal representations?
Slideshow and “reveal” analysis developed and written by Brenda Taylor, Juneau STEM Coalition, with some advising by Paula Casperson, JDHS: Yadaa.at Kale principal.
Additional Resources:
- Sketching STEM representation by Gabrielle Vance (Juneau Empire, April 2018)
Visualization Type: Table
Data Source:
Visualization Source: