
Slow Reveal
Notice, Wonder, Connect
(So many great) Student Suggestions for Catchy Headlines: “The Pie Food,” “Alaska’s Meat Pie Charts,” “Animals That Die the Most,” “Wild Foods We Use,” “The Harvesting of Two Places,” “The Harvests of Alaska,” “Surf and Turf in Alaska,” and “Alaska’s Different Diets.”
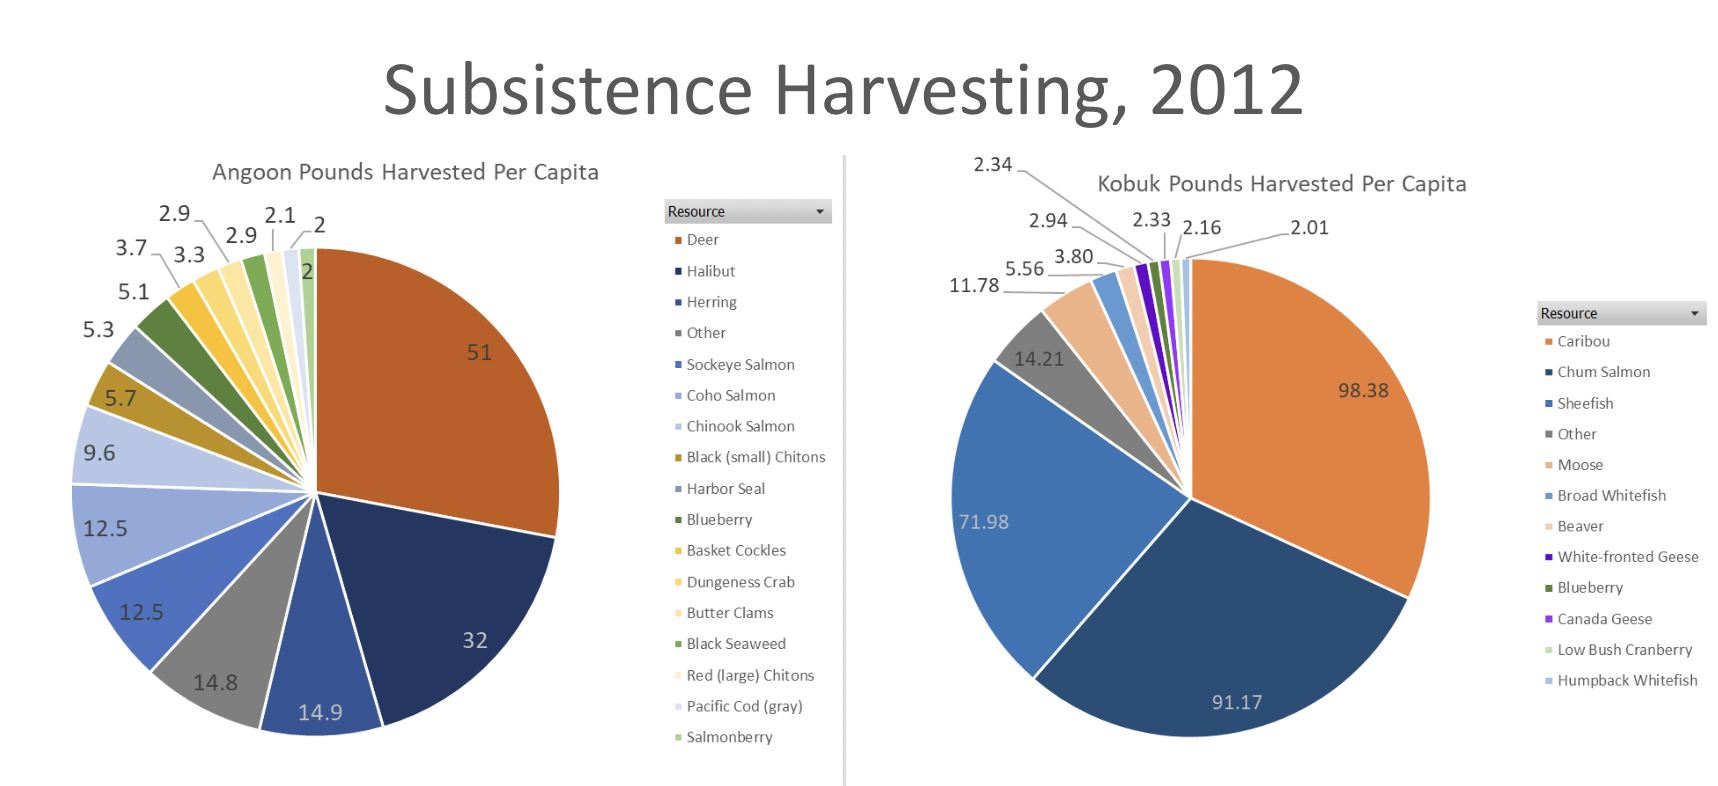
These graphs show the subsistence harvest of two villages in Alaska based on household samples conducted by the Alaska Department of Fish and Game, Subsistence Division. Harvest is converted to pounds for consistency in comparison.
Subsistence harvesting is a crucial way of life for many Alaskan Natives. Alaska state law and federal law define subsistence uses as the “customary and traditional” uses of wild resources for various uses including food, shelter, fuel, clothing, tools, transportation, handicrafts, sharing, barter, and customary trade. To determine if a resource is associated with subsistence, there are eight criteria Alaska Department of Fish and Game look at. They are: length and consistency of use; seasonality; methods and means of harvest; geographic areas; means of handling, preparing, preserving, and storing; intergenerational transmission of knowledge, skills, values, and lore; distribution and exchange; diversity of resources in an area; economic, cultural, social, and nutritional elements.
Angoon and Kobuk both display a large amount of subsistence harvesting. Angoon displays a much broader diversity of food then Kobuk. Kobuk, however, has a much larger amount of harvesting per person. Interestingly, both communities do the majority of their harvesting of fish (many different types), but their largest single resources are land mammals (deer in Angoon and caribou in Kobuk). There is virtually no overlap in what resources they are collecting though. This is due to the vastly different climate Angoon has in the Southeast compared to Kobuk in the Interior.
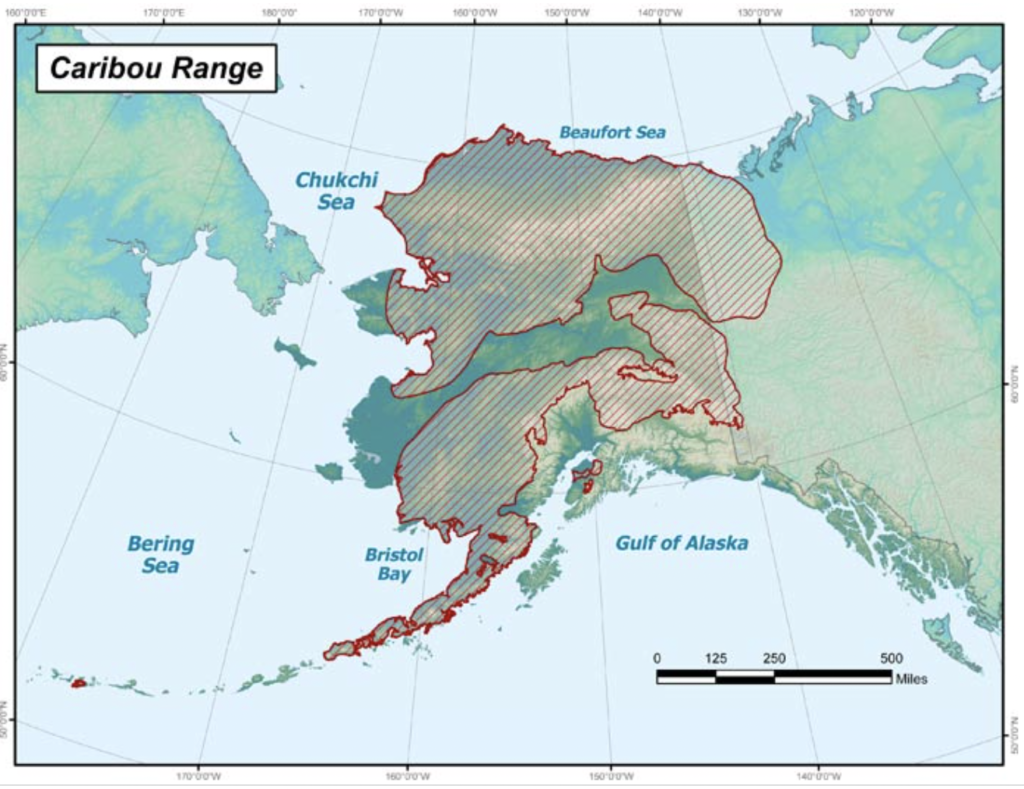
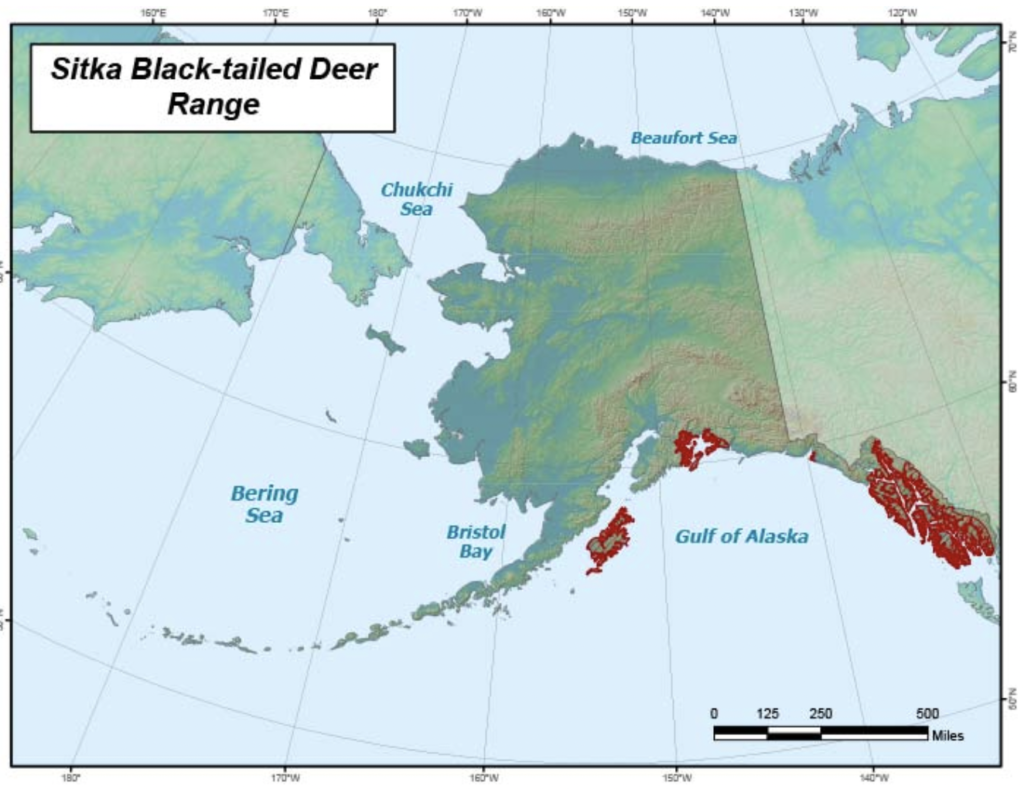
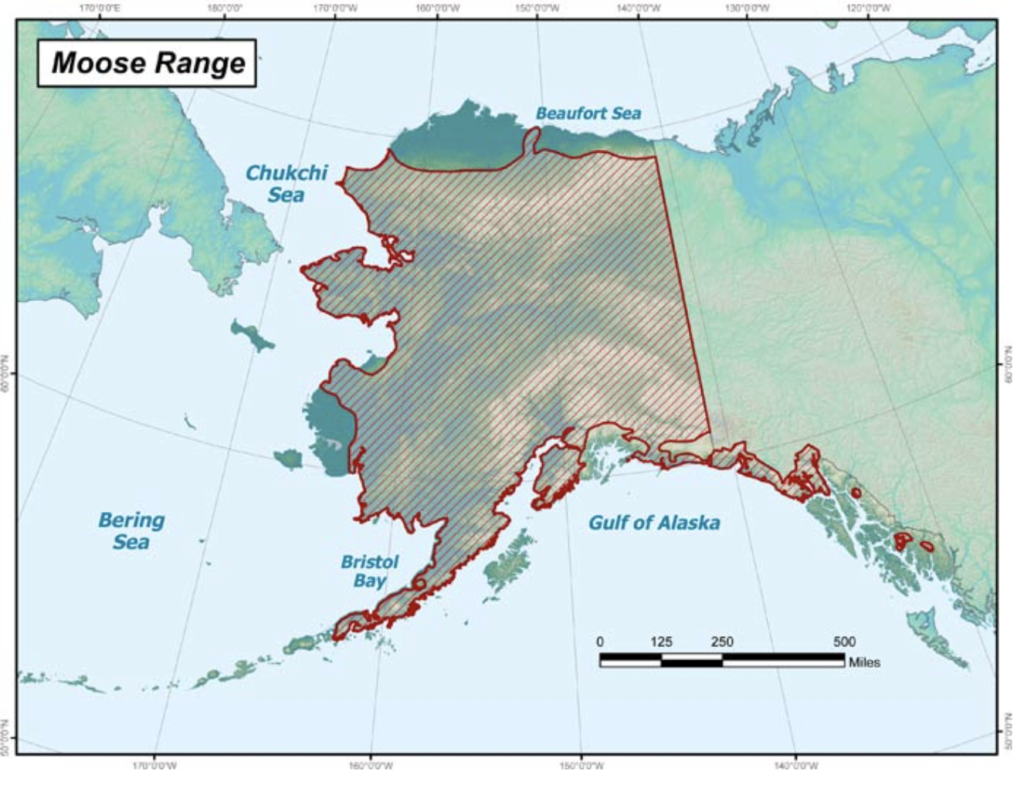
There were lots of questions from students about the range of animals, especially caribou and deer, so we’re adding some maps below and a website for you to research more animals.
Another student noticed that there was more chum salmon harvested in Kobuk than in Angoon. We asked Flynn Casey, who works at ADFG, for more insight on that and he said:
“To start with a simple answer, chum salmon do appear in the Angoon harvest data…. The number for chum is 1.3 pounds per capita. …[A]ny resource that clocks in under 2 pounds per capita gets binned into the ‘other’ category….
It’s also important to remember that the data represents this snapshot in time which could be an outlier in some way(s). For example, 2012 seems to be a year of relatively weak salmon returns compared to prior years during which subsistence harvest data was collected, both for Angoon and Kobuk….
While there are probably several factors relating to that big difference in chum harvest, a little scanning of the relevant tech papers (399 for Angoon; 402 for Kobuk) suggests that it is largely driven by how much each community targets chum salmon compared to other salmon species. Chum are the only species of salmon to be found in significant quantity near Kobuk (notice no other salmon species shows up in the Kobuk pie chart), so it’s a highly targeted fish. For Angoon, much of the 2012 subsistence fishing effort targeted coho and Chinook salmon, either by trolling or rod-and-reel, in coastal waters. The remaining salmon species can be caught among the same few systems of inside protected waters, but most of the effort there was for sockeye salmon.
*Another interesting factoid from the Kobuk paper: while similar weights of caribou and chum salmon were harvested in 2012… “Many respondents reported that they were not able to adequately dry much of the salmon they harvested because of incessant rain. As a result, households fed spoiled salmon to dogs in order to avoid wasting the resource.””
Finally, several students said they were surprised that there was so much caribou harvested in Kobuk and so little moose, especially because that’s so different from hunting around Fairbanks. They wondered what the graph of Fairbanks would look like. We highly recommend that you look at information below about making a graph about your own community. Email us at juneaustemcoalition@gmail.com with questions – or with your completed graphs. We’d love to add them to this post!
Additional Resources:
- Technical Paper No. 399 (Alaska Dept of Fish and Game)
- Technical Paper No. 402 (Alaska Dept of Fish and Game)
Visualization Type: Pie Chart
Data Source: Community Subsistence Information System, Alaska Department of Fish and Game, Subsistence
Visualization Source: Craig Fox using Microsoft Excel.
It can be replicated with medium effort and medium technical skill. First determine if the communities you want to use have data by checking the Community Observer Interactive Map of Geographic Survey Data. Only use communities with comprehensive data. For comparison purposes try to only use one village and compare over time, or compare multiple villages in the same year. Once you identify the communities and years you want to use, go to the Community Subsistence Information System. Select “Harvest by Community”, then select the community you would like to view. Select which year you want under “Project Years Available”. Check the box that says “Include Only Primary Species in Download”. Then click “Create Excel File”. Repeat this process for each community or year you want to use. Next download the file below called “Subsistence Harvesting Make Your Own”. Replace the data on the sheet called “Replace with Downloaded Data” with the data you got from the Community Subsistence Information System. Then go to the “Pivot Chart and Graph” tab. Click somewhere on the chart. On the ribbon at the top, a new option called “PivotTable Analyze” will appear. Select that and then click “Refresh”. The graph will now display the data. Change the title of the graph and update the colors. Repeat this process for each graph you want.
what random place in the world to pick Angoon and Kobuk? Why do we need to know why subsistence harvesting in 2012? I wonder why the dog samen are up in kobuk. I do go hunting myself in Hoonah for deer.
what random place in the world to pick Angoon and Kobuk? Why do we need to know why subsistence harvesting in 2012? I wonder why the dog samen are up in kobuk. I do go hunting myself in Hoonah.
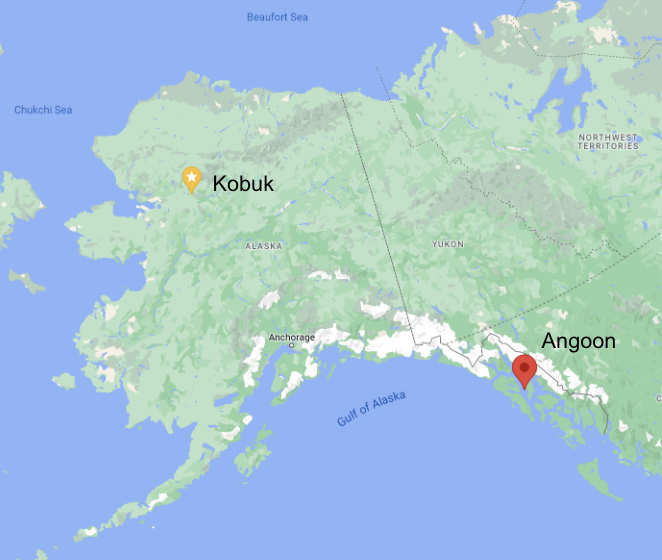
Hi, Sam. That is a good question. Alaska Department of Fish and Game picks a few communities each year to study and record detailed harvest records from. We need to use communities from the same year, so we can properly compare communities. Kobuk and Angoon were chosen because they provide a good contrast between Southeast and Interior Alaska.
I was surprised on how much variety Angoon has compared the Kobuk.
I wonder how many people live in Kobuk.
I can connect by fishing, my family and I fish a lot.
What surprised me was the amount of food me and my family eat and get harvested from Angoon and kobuk.
I wonder why they mostly harvest Deer and Caribou?
I connect with this because most of the food me and my family eat is deer.
I was suprised that it had somthing to do with food
I was surprised by the amount of chum the eat in Kobuk, I personally don’t like chum but I guess it is easier to get in large amounts.
I wonder if there was a reason they took this data or maybe just for fun?
This reminds me of when people count the animal population because in a way they are similar.
Hi, Stahly. All good thoughts. There are a lot of good uses for this data. It can be used to investigate the nutrition of native diets, get an estimate for animal population migration, looking into native harvesting behavior, and much more.
I was surprised by what the graph was about
I wonder why we have to know about graphs
I connect to this graph by learning about them
The graph I am looking at is the substance harvesting graph. I notice that caribou and deer take up the most space making them the majority. I wonder what makes up others. The chart compares two places in Alaska. A fantastic headline would be Alaska’s dead food.
I was surprised at how much caribou was hunted in Kobuk. I wonder how they get so many pounds of caribou? I also wonder why there are such little amounts of salmon berries in Angoon? I connect to fishing for halibut and hunting for deer because my family hunts and fishes for it.
I was surprised by how much meat both places harvest.
I wonder what a graph of people’s favorite foods in Kobuk and Angoon would look like.
I can connect to this because my family eats a lot of salmon.
I was surprised that Kobuk eats much more caribou than Angoon does deer.
I wonder who collected the data and what an up-to-date graph would look like.
I can connect this to previous experience as I notice that southeast Alaskans harvest a lot of fish.
I noticed that both charts had different kinds of fish listed, how did the interior town get the fish? The graph relates to the community by showing what types of food Alaska has. I think a good name for the graph would be The Pie Food because the pie charts show different percentages of foods.
Good question Regan. Kobuk is along the Kobuk River, so they can get fish from there.
Something I noticed is that Angoon has a longer list of food than Kobuk does. I also noticed that Kobuk is closer to the interior than Angoon. Is this why Angoon has a longer list of food? This relates to me and my community in a few ways, one, my grandpa goes hunting, and loves to bring home a lot of meat, two I live in Alaska as well as the population of Kobuk and Angoon. It’s kind of hard to come up with a catchy title for this graph, however, something that I was thinking of is Alaska’s Meat Pie Charts.
Aliyah,
I noticed that Angoon’s list is much longer as well – so a bigger variety of food types. Did you also notice that although Kobuk’s list is shorter, the numbers are much higher, meaning that they harvest more pounds of food per person than in Angoon. Do you have any ideas why that might be?
Do you ever go hunting with your grandpa? Do you have any idea about how many pounds he brings home each year and how that compares to the averages in these two communities? Another thing to think about is how much he shares what he hunts with others – or how much others share with him. This graph shows the average per capita, so some people harvest more and some harvest less.
Do you think harvesting in Fairbanks – hunting or fishing or collecting other foods – is closer to the harvesting in Kobuk or Angoon?
Thanks for all your thoughtful comments and curiosities. 🙂
I notice that there is a ton of information on the graph. I wonder why deer and caribou are the most taken. This is different than I thought because we go moose hunting.
Doug,
That’s super interesting to think about. Here, in Juneau, we very rarely see moose, let alone hunt them (though there is moose hunting on the mainland in Southeast like in Gustavus and on some of the islands like Kake). We do lots of deer hunting and no caribou hunting here. I see that there is some moose hunting in Kobuk, but – as you noted – much less than the caribou hunting.
It’d be really interesting to look at the specific data for Fairbanks and compare that to Kobuk (and Angoon). If you go to the explanation about the this graph (above these comments), you’ll find the directions how to do that. We’d love to see it – and post it – if you make one. Email us at juneaustemcoalition@gmail.com if you want some help or if you get it done all by yourself.
In the Subsistence Harvesting Graph, I notice that the main animals harvested are caribou. I wonder why there is such a low percentage of moose harvested. this relates to my community because my family really likes to hunt and my grandpa was a fisherman. A catchy headline would be The Animals That Die The most Graph.
Penelope,
I think it’s super interesting to wonder – and find out what moose is so much less in Kobuk than in Fairbanks. Do you do any caribou hunting? Did your grandpa fish for any of the types of fish that are listed in Kobuk (or Angoon) or for different types? I just responded to Doug suggesting that he follow the directions to see if there’s data from Fairbanks that you can make into pie charts as well. Talk to Doug, look at the comment I wrote to him and keep us posted!!
P.S. Your headline is definitely “catchy” (especiallly when we’re talking about catching animals…. I’ve added it to the student titles at the top of this page.
The two places are very different in there food sources with Angoon have a lot more variety than Kobuk. I think the only shared food source is blueberries. I think it would be interesting if we could see two graphs of the same place and compare the substance harvesting to the food they buy at stores and stuff. This graph is relatable to the community because a lot of us fish or hunt and nearly everyone has picked blueberries. A catchy title could be “Wild Foods We Use”
Ali,
I love your suggestion about comparing food from subsistence harvesting to food bought at stores. I’m copying your comment and sending it to Craig Fox, our data magician, to see what ideas he has about if anyone is collecting that data. One possibility is for your class to collect some of your own data about where you all get your food from. That’d be pretty interesting.
I added your title to the top of this page. 🙂
Something that I noticed from the graph is that Kobuk harvests much more Caribou meat than Angoon. I wonder why Angoon is harvesting so much less than Kobuk. This relates to me because it shows that more meat is harvested near where I am than in the lower part of Alaska. A catchy headline for this graph would be, ‘The Harvesting of Two Places.’
Something I noticed about this graph is that Kobuk harvests more caribou and chum salmon than Angoon. I wonder why Angoon harvests a bigger variety of subsistence than Kobuk. The reason I think this relates to me and my community is because it is nice to know where some of the alaskan food is harvested. I think a catchy headline for this would be, “Alaskan Subsistence”.
Kaylee,
I hadn’t noticed that about the chum salmon – and that chum salmon doesn’t appear at all in Angoon’s list. I’ve written to a friend of mine who works for Alaska Fish and Game to see what he says.
Thanks for being so observant!!
Kaylee,
I heard back from friend with Fish and Game and this is what he said:
“To start with a simple answer, chum salmon do appear in the Angoon harvest data. You are correct in thinking that the harvest is just very low, though it’s not far off some of the resources that do appear in the graph for Angoon. The number for chum is 1.3 pounds per capita. It seems as though any resource that clocks in under 2 pounds per capita gets binned into the ‘other’ category when the pivot table and pie chart are made.
So the student is correct since 1.3 is a lot less compared to Kobuk’s 91.17 pounds per capita!
It’s also important to remember that the data represents this snapshot in time which could be an outlier in some way(s). For example, 2012 [the year of the graph] seems to be a year of relatively weak salmon returns compared to prior years during which subsistence harvest data was collected, both for Angoon and Kobuk (there are many F&G staff/resources that can speak better than I to long-term trends in salmon returns and harvest, though).
While there are probably several factors relating to that big difference in chum harvest, a little scanning of the relevant tech papers (399 for Angoon; 402 for Kobuk) suggests that it is largely driven by how much each community targets chum salmon compared to other salmon species. Chum are the only species of salmon to be found in significant quantity near Kobuk (notice no other salmon species shows up in the Kobuk pie chart), so it’s a highly targeted fish. For Angoon, much of the 2012 subsistence fishing effort targeted coho and Chinook salmon, either by trolling or rod-and-reel, in coastal waters. The remaining salmon species can be caught among the same few systems of inside protected waters, but most of the effort there was for sockeye salmon.
The tech papers are admittedly dense to sift through to find what you’re looking for, so if your group has specific questions they decide to pursue further, I’m sure the authors of those papers would be a great resource. It looks like the lead editor of the Angoon paper is still a Subsistence Resource Specialist here in Juneau (lauren.sill@alaska.gov).
*Another interesting factoid from the Kobuk paper: while similar weights of caribou and chum salmon were harvested in 2012… “Many respondents reported that they were not able to adequately dry much of the salmon they harvested because of incessant rain. As a result, households fed spoiled salmon to dogs in order to avoid wasting the resource.”
Something I noticed about the “Angoon Pounds Harvested Per Capita” and the “Kobuk Pounds Harvested Percapita” graphs is the large number of pounds of deer harvested in Angoon and the large number of pounds of Caribou harvested in Kobuk. I wonder why there are more deer and caribou being harvested in these places compared to other animals. This relates to my community because it lets me know what animals are being harvested more and what the people living in these places are most likely eating. A catchy headline could be “The harvests of Alaska”.
I noticed that Kobuk gets much more meat per Capita. I wonder there is so much meat in Kobuk. This relates to me because it shows the types of food and how well the items are harvested in each place.
Catchy Headline: “Harvesting across Alaska!”
Something that I notice about this graph is that Kobuk harvested a lot more salmon and other fish than Angoon. I wonder why this is? This relates to me because I love salmon. A catchy headline for this is “Angoon vs Kobuk”.
what I have noticed is that caribou and deer are being hunted or diving the most.what do I wonder is how moose such a small rate I would expect that to be bigger.how dose this relate to my community I think that we have almost all of these animals so that is how I think it relates to us.what is the head line for this is deer and caribou take over.
i noticed that the orange part is really big. and the dark blue part is also very big in both of the maps.i wonder why it is like that.
I am going to talk about graphs here. First thing I notice is kobuk is more north than Angoon, Angoon is near Juneau. There are more animals to choose from in Angoon. I wonder why there are more animals to choose from in angoon. It effects to get diffrent kind of foods. A catchy headline would be Compared two graphs.
I wondered why deer is the highest in Angoon, at 51 per capita, and why caribou is the highest in Kobuk. Is that from there being more caribou in one area, or maybe they only migrate so far? And why does Kobuk have fewer variations and Angoon has a significant difference? I noticed that in this graph is that Kobuk seems to harvest much more meat than Angoon. I wonder why Kobuk seems to harvest at least twice as much as Angoon. This relates to me by showing me what types of food I am most likely going to heat if I were to harvest things.
Lauren,
Great questions and predictions. There are no caribou down here in Southeast Alaska. Here’s a map of caribou range: https://www.adfg.alaska.gov/index.cfm?adfg=caribou.rangemap
Here’s a map of deer: https://www.adfg.alaska.gov/index.cfm?adfg=deer.rangemap. I think, based on your questions and those of your classmates, I’ll add these maps to our text!
There certainly are significant differences in how much total and how many different types of things are harvested in those two places. I’ll see if I can find some more definitive information about why.
i notice in this alaska graph that there are much more big game in kobuk pounds than there are big game in angoon pounds. i wonder why angoon has much more even numbers than kobucs uneven numbers. this relates to me and my community because it means that we are loosing alot of anamals. a catchy headline is Alaska’s harsh harvest.
deer is the main part of this graph. halibut is the next largest part of the graph.for the second graph kobuk pounds. caribou is the largest part of it.
I wondered why deer is the highest in Angoon, at 51 per capita, and why caribou is the highest in Kobuk. Is that from there being more caribou in one area, maybe they only migrate so far? And why does Kobuk have less variations, and Angoon has a significant difference? I also think a good name would be like “The PI of food”
I noticed that caribou, chum salmon and sheefish are harvested the most. I wonder how much the percentage of caribou will go up in the years. This relates to my community because I hunt caribou and the less there are the less I can hunt. A catchy headline would be The Percentages of Harvesting.
Owen,
Have you noticed that caribou is more or less easy to hunt? What do the people around you who have been hunting longer say?
One thing that I notice is that the deer is the biggest in the Angoon and caribou is the biggest in Kobuk. When the animals are similar and the places are in such different places, it’s interesting. I wonder if these pie charts are all the resources they use or just some of them. A new headline would be “Resources From Two Different Places.”
Something I noticed is that Caribou and Deer have biggest amount of orange. I wonder what per Capita means. This relates to my community by how much me and my mom harvest compared to my siblings. A catchy headline would be “The Harvesting of Alaska”
Nathan,
Per capita means, literally, “per head” (from Latin). So per capita means the average amount of food each person in that community harvests. Some harvest lots and some harvest little or none, but if it’s all counted and then divided up, that’s the per capita amount.
The graph I am looking at is the substance harvesting graph. I notice that caribou and deer take up the most space making them the majority. I wonder what makes up others. The chart compares two places in Alaska. A fantastic headline would be Alaska’s dead food.
Anna,
Alaska’s Dead Food definitely catches my attention – though in a weird way. I guess all food is dead once we’re ready to put it in our mouths, but it’s weird to label it like that. How do you think other students would react to that title? Would they be more or less likely to read? More likely, maybe?
I notice that in Alaska caribou is the main source of food I also notice and the different tribes harvest different amounts. I wonder why this is so, and why they use many different sources of food. in our community, this relates to how different people like different things. I think a sketchy headline for the graph is Peoples and Their Harvesting.
Bella,
Why is that a sketchy headline?
After looking at the Subsistence Harvesting Alaska Graph I noticed many things. First of all, I saw that because Kobuk is much more north than Angoon they harvested different things. For example, they gathered lots of Caribou but no deer because there aren’t any deer where Kobuk is located. I also noticed that it is the same the other way around and there was no Caribou in Angoon. I wonder at what point north deer stop being able to survive. This graph affects my community because it shows how the climate can affect things around us including our subsistence resources. I think a catchy title for this graph would be, “Alaska’s different diets”
George,
So many interesting observations – and questions. Have you done some googling about the range of deer, caribou and moose? In the little googling I did, it looks like Sitka black tailed deer are only along the coast and there’s some introduction of mule deer and white tailed deer from Canada. It’d be interesting to see a map that showed all three. If I find one, I’ll let you know – and if you find one, let me know at juneaustemcoalition@gmail.com and we’ll post it on this page. That’d be a great addition.
I notice that there are more variety plants and fish in Angoon Alaska and there are more land animals like caribou in Kobuk. I wonder why Kobuk and Angoon Alaska were chosen for the two graphs? This relates to my community by showing how from in land towns get food and how ocean towns get their food. A new head line for this graph is surf and turf in Alaska.
Kolton,
Thanks for asking about why we chose Kobuk and Angoon. We wanted to choose one coastal community and one interior community – just like you suggested (particularly because the classes doing these graphs are coastal and interior). We wanted to compare two communities from similar time periods and with somewhat similar populations so we had to look through the data that Alaska Fish and Game has collected to find which communities had data that was comparable.
Caribu and Deer had the space making up the majority of the graph. I wonder why orange is the biggest on both graphs. This relates to my community by showing me what food I eat. I good headline for this graph is Alaska Road Kill.
I notice that the Angoon have more types of food harvested that the Kobuk. I wonder why the Kobuk have more water-type food. I eat caribou so it is helpful to know where to get it. A catchy headline is harvesting in Alaska.
Jacob,
How did you decide that Kobuk has more water-type food than Angoon? Did you add up numbers or estimate “by eye?”
I’m curious about the caribou you eat. Does your family hunt it, or do others gift it to you? Do you know where it’s hunted?
Something that I notice in this graph is that Kobuk seems to harvest much more meat than Angoon. I wonder why Kobuk seems to harvest at least twice as much as Angoon. This relates to me by showing me what types of food I am most likely going to heat if I were to harvest things.
A catchy headline for it is, ‘The meat of Alaska’