
Slow Reveal
Notice, Wonder, Connect
“La Nina Triple Dip” Seasonal Forecasts in Alaska, Winter 2022-23
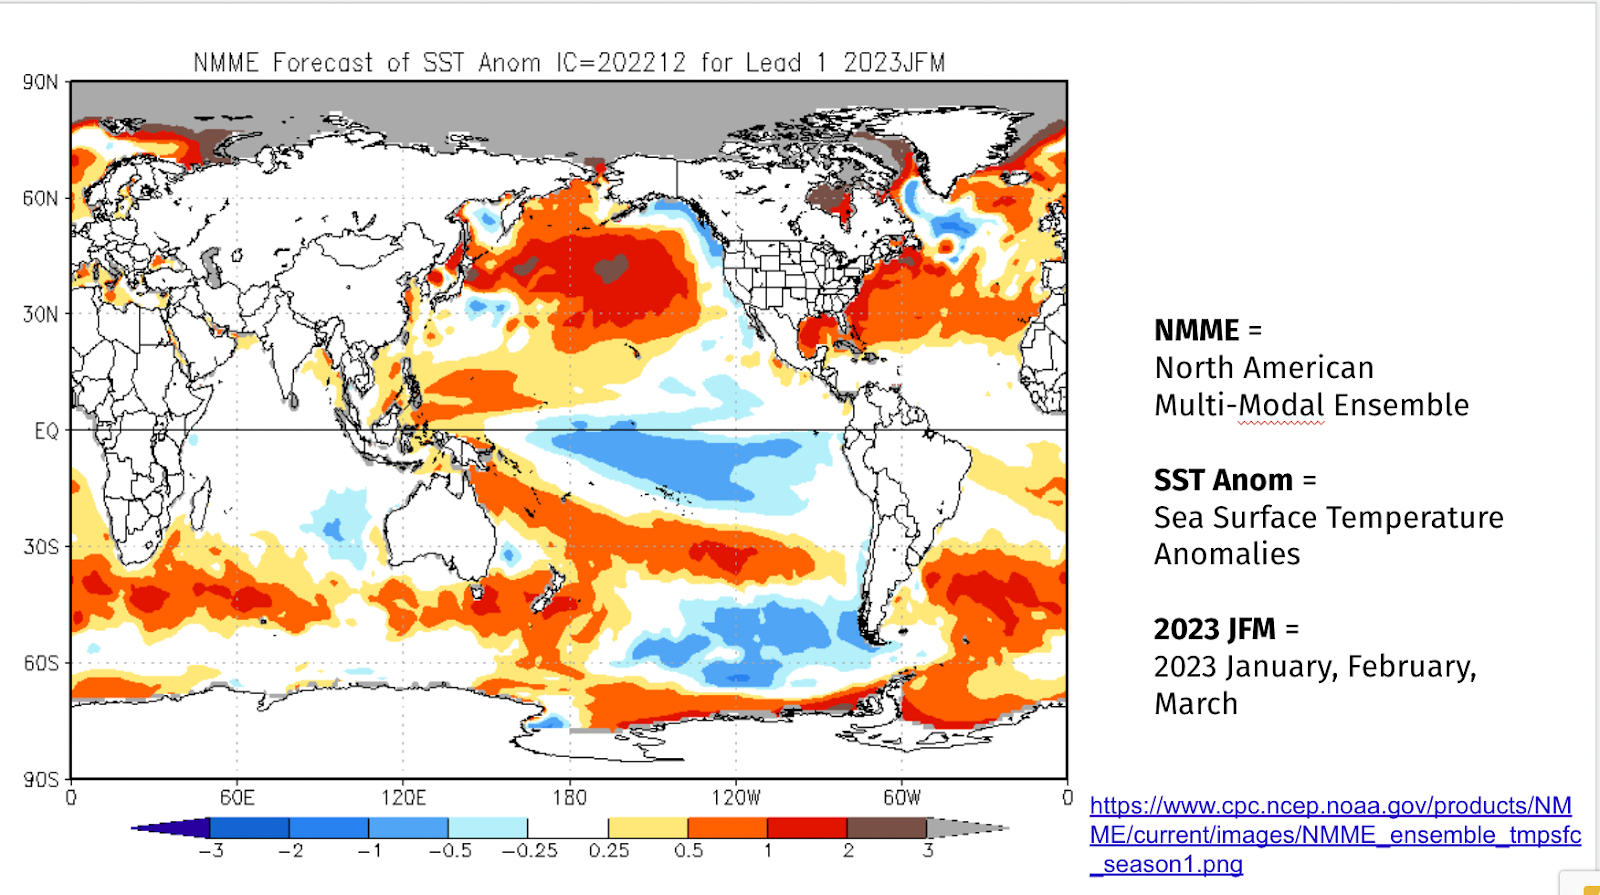
Predicted SST anomalies (˚C) for January-March 2023 from the National Multi-Model Ensemble (NMME) of coupled atmosphere-ocean climate models.

These two graphs show some of how and what NOAA predicts for 2022-2023 winter seasonal outlooks (climate) for precipitation and temperature. The first graph (of projected sea surface temperatures) are a major factor in generating the predictions for the second graph (of predicted temperatures on land.) Overall, the second graphs shows that it is more likely that it’ll be warmer than normal in Northern Alaska and the Aleutian chain and that it’s more likely that it’ll be colder than normal in South Central and Southeastern Alaska. Note, this does not mean this is what will happen for sure; these are predictions of likelihood. Remember that: “Climate is what you predict, weather is what actually happens.” (National Centers for Environmental Information)
Nicholas Bond, a NOAA scientist, explains the creation of the first graph through the National Multi-Model Ensemble (NMME). He writes, “an ensemble approach incorporating different models is particularly appropriate for seasonal and longer-term simulations; the NMME represents the average of eight climate models. The uncertainties and errors in the predictions from any single climate model can be substantial. More detail on the NMME, and projections of other variables, are available at the following website: http://www.cpc.ncep.noaa.gov/products/NMME/.”
According to National Weather Service climate researcher Brian Brettschneider, there are three main factors that scientists use in making long-term seasonal forecasts for Alaska:
1) whether it’s a La Nina or El Nino, (or neutral) year
2) the evolution of sea ice in the Chukchi and Bering Seas, and
3) long-term trends
La Nina
As the climate.gov staff explain, “El Niño and La Niña are opposite phases of a natural climate pattern across the tropical Pacific Ocean.” El Nino is the warm phase, La Nina is the cool phase and there is a neutral phase as well in between the two when the temperatures and winds are closer to (long-term) averages. Generally, each phase lasts about a year, though it’s not uncommon for La Nina to last 2 years (and, once, 33 months.) During La Nina, in the tropical Pacific, surface winds are stronger and temperatures are cooler than average. La Nina (and El Nino) years are often factors in more extreme weather conditions in the rest of the Pacific area.
It’s this pattern (yes, in the tropics!) that has the greatest impact on what kind of winter we’ll have here in Alaska. What causes this climate pattern swing is not yet well understood, but the impacts of the swing around the earth are significant and are closely monitored and analyzed. This year, unusually, we are in a third year of a row of La Nina, (For more information, look here.)
Brettschneider describes the most likely effect of La Nina in Alaska: “More times than not, La Niña winters are colder than average in Alaska. Not every time, but a majority of times. So that represents about 40% of the variability [in seasonal predictions].” (APR)
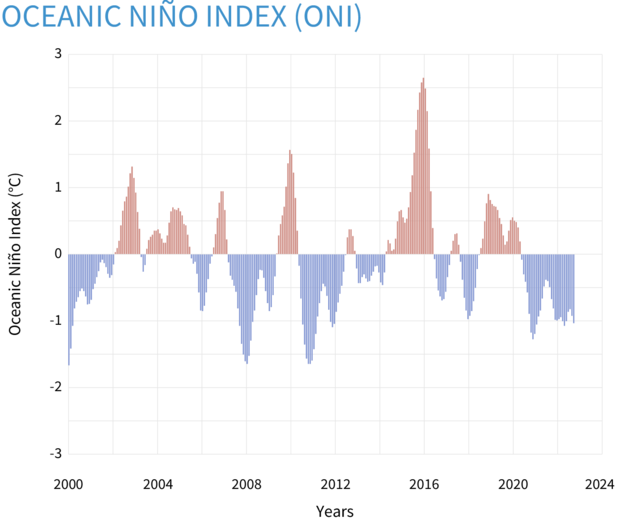
Seasonal (3-month) sea surface temperatures in the central tropical Pacific Ocean compared to the 1981-2010 average. Warming or cooling of at least 0.5˚Celsius above or below average near the International Dateline is one of the criteria used to monitor the El Niño-La Niña climate pattern. NOAA Climate.gov image, based on data from the Climate Prediction Center. The Oceanic Niño Index (ONI) is NOAA’s primary indicator for monitoring the ocean part of the seasonal climate pattern called the El Niño-Southern Oscillation, or “ENSO” for short. (The atmospheric part is monitored with the Southern Oscillation Index.) (climate.gov)
Sea ice in the Chukchi Sea and the Bering Sea
Brettschneider points out that, “[The sea ice is] kind of getting a late start right now. And when that water is open with no ice on it, there’s a lot of heat that can be liberated into the atmosphere, and it keeps things warm.” (APR)
Trend
Brettschneider reminds us of what we all know: “The trend is warming. You know, if you just woke up from a coma, and someone said, ‘What do you think it’ll be? What do we think the winter will be like?’ You should probably say, ‘I don’t know, but it’s probably going to be warmer than winter used to be,’ just because things are warmer now.” (APR)
There are a variety of other factors that impact the actual (daily) weather we have that NOAA can’t use in seasonal predictions because they happen on short timescales. Those short term factors are things like where the jet stream will be or what the trajectory of sea ice will be.
Why do these seasonal forecasts matter? As NOAA staff write, “Seasonal outlooks help communities prepare for what is likely to come in the months ahead and minimize weather’s impacts on lives and livelihoods. Resources such as drought.gov and climate.gov provide comprehensive tools to better understand and plan for climate-driven hazards. Empowering people with actionable forecasts, seasonal predictions and winter weather safety tips is key to NOAA’s effort to build a more Weather– and Climate-Ready Nation.” (NOAA)
NOAA’s Climate Prediction Center updates the three-month outlook around the 15th of each month. For the latest predictions, go to https://www.cpc.ncep.noaa.gov/products/predictions/long_range/
Additional Resources:
- Climate Variability: Oceanic Nino Index (Rebecca Lindsey, climate.gov, https://www.climate.gov/news-features/understanding-climate/climate-variability-oceanic-ni%C3%B1o-index
- El Nino and La Nina: Frequently Asked Questions (climate.gov staff) (https://www.climate.gov/news-features/understanding-climate/el-ni%C3%B1o-and-la-ni%C3%B1a-frequently-asked-questions)
- “U.S. Winter Outlook: Warmer, Drier South with Ongoing La Nina” (NOAA, https://www.noaa.gov/news-release/us-winter-outlook-warmer-drier-south-with-ongoing-la-nina)
- “Alaska sees third La Niña winter forecast in a row” (Casey Grove, Alaska Public Media – Anchorage -November 7, 2022; https://alaskapublic.org/2022/11/07/alaska-sees-third-la-nina-winter-forecast-in-a-row/
- What’s the Difference Between Weather and Climate? (National Centers for Environmental Information, https://www.ncei.noaa.gov/news/weather-vs-climate#:~:text=Whereas%20weather%20refers%20to%20short,regions%20can%20have%20different%20climates)
- “After Three La Nina years in a row, Alaska’s cold climate luck is about to run out” (Casey Grove, Alaska Public Media, Jan 18, 2023)
Visualization Type: Heatmap
Data Source:
Visualization Source: