
Slow Reveal
Notice, Wonder, Connect
Students’ suggestions for catchy graph titles: “Powering Alaska,” “A Heated Topic”, “Electricity and Alaska.”
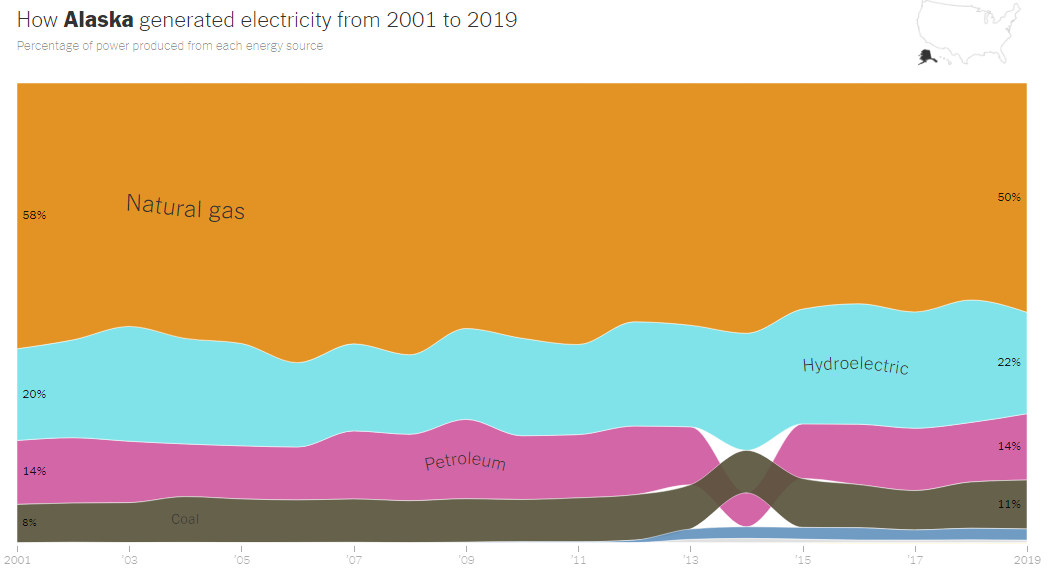
This graph shows Alaska’s electricity generation since 2001. It is based on data reported to the United States Energy Information Administration. It shows the relative percentages of each form of electricity generation.
Electricity can be generated using different methods. One way to generate electricity is by burning fossil fuels. Burning these fuels releases heat that can boil water to create steam. The steam turns turbines that can power an energy grid. A less efficient method of converting fossil fuel to electricity is necessary in smaller power plants and backup generators throughout Alaska; there, diesel engines or diesel-fired turbines are used. Petroleum (oil), natural gas, and coal fall into the category of fossil fuels. This type of energy production releases carbon dioxide and other greenhouse gasses into the atmosphere, contributing to climate change.
There is also renewable energy, which uses the natural world around us to produce energy. Hydropower harnesses the kinetic energy from flowing water. In Southeast we have relatively low flow, but lots of “head pressure.” In the lower 48, the large river system hydro plants rely more on flow. Wind turbines, powered by moving air, use the energy from wind in motion. Photovoltaic solar panels absorb solar energy from the Sun, converting it to electricity that we can use. Around 5-20% of the solar energy is converted to electricity. Geothermal energy uses the heat from the Earth’s core to create electricity, usually by powering a steam turbine.
This graph shows the different energy sources used to generate electricity in Alaska from 2001 to 2019. Note that this graph shows energy generation, the conversion of a fuel source (diesel, wind, etc) to electric energy. This is different from electricity consumption. Because of Alaska’s geography, its electrical grids are disconnected from the rest of the United States and Canada. This means that no electricity is imported to or exported from Alaska. Other states, by contrast, may generate as little as 2/5 of the electricity that they actually consume. In Southeast Alaska, the only communities connected to one another are Prince of Wales Island, Ketchikan-Wrangell-Petersburg, and the Haines-Chilkat Valley. It is also important to note that this graph only shows which energy sources produce electricity. Alaska produces additional energy, mainly through oil, but the vast majority is not used for electricity generation in Alaska. The crude oil is shipped out of state to be refined and then shipped back to Alaska for various uses including space heating and transportation.
Since 2001, Alaska’s electrical grid has mostly been powered by natural gas. In 2019, natural gas powered 50% of Alaska’s electricity. Large metro areas like Anchorage, the Matanuska Valley and the Kenai Peninsula use mostly natural gas. The second biggest contributor to Alaska’s electrical grid is hydropower, which powered 22% of Alaska’s electricity in 2019. Hydropower is most common in Southeast and Southcentral regions. Petroleum (14% in 2019) and coal (11% in 2019) come next. Smaller villages mostly use petroleum. Coal is used to generate electricity in Fairbanks. Wind power systems have been developed along the coast, along the road system and in remote areas.
Alaska went from having 11 wind turbines to having 59 in 2012, when advancements in technology made the construction of wind turbines more cost effective. The rise in wind power was also due in part to federal tax incentives. The incentives did not have as big an impact in Alaska as in other states because most of the utilities in Alaska are nonprofits and do not pay income taxes. There were two wind projects – one in Anchorage and one in Fairbanks – that were built by developers who did take advantage of the tax credits.
Direct federal funds have had some impact on increasing the use of renewable resources in Alaska. It was a federal grant that paid for a transmission line to connect Greens Creek Mine to Juneau’s electric system (dramatically reducing diesel usage by the mine.) The state of Alaska set up a Renewable Energy Fund in 2008 which has since funded a number of electric generation projects.
Looking ahead, the new federal infrastructure bill is written to make certain tax credits refundable for municipal utilities and coops, which will open other opportunities. Furthermore, with oil prices high again, the state is again putting money into the REF Grant program.
In 2014, petroleum usage fell. Coal usage remained constant, but the decrease in petroleum meant that coal became a larger percent. However this was temporary. The reason that the coal and petroleum areas switched places on the graph is that the colored bands are ordered from highest percent to lowest percent, and during 2014, petroleum’s percent was briefly lower than coal’s percent. Frankly, we’re still trying to figure out what caused that dip in petroleum.
Do you think this graph is easy to understand? If so, what makes it easy? If not, what aspects of the graph do you think are confusing or unnecessary?
Additional Resources:
- Alaska State Profile and Energy Estimates, U.S. Energy Information Administration
- Interactive Electricity Production Map, U.S. Energy Information Administration
- Wind Technology Briefing, UAF Alaska Center for Energy and Power
- Alaska Energy Authority Invests $4.9 mil in state’s largest solar farm (KTOO, 11/30/22)
A special thanks to Alec Mesdag from AEL&P for his assistance in this explanation.
Visualization Type: Stacked Area Graph
Data Source: U.S. Energy Information Administration
Visualization Source: How Does Your State Make Electricity?, NYTimes
It can easily be replicated. Go to the NYTimes article and select the state you want to see.