
Slow Reveal
Notice, Wonder, Connect
Students’ suggestions for catchy graph titles: “Powering Alaska,” “A Heated Topic”, “Electricity and Alaska.”
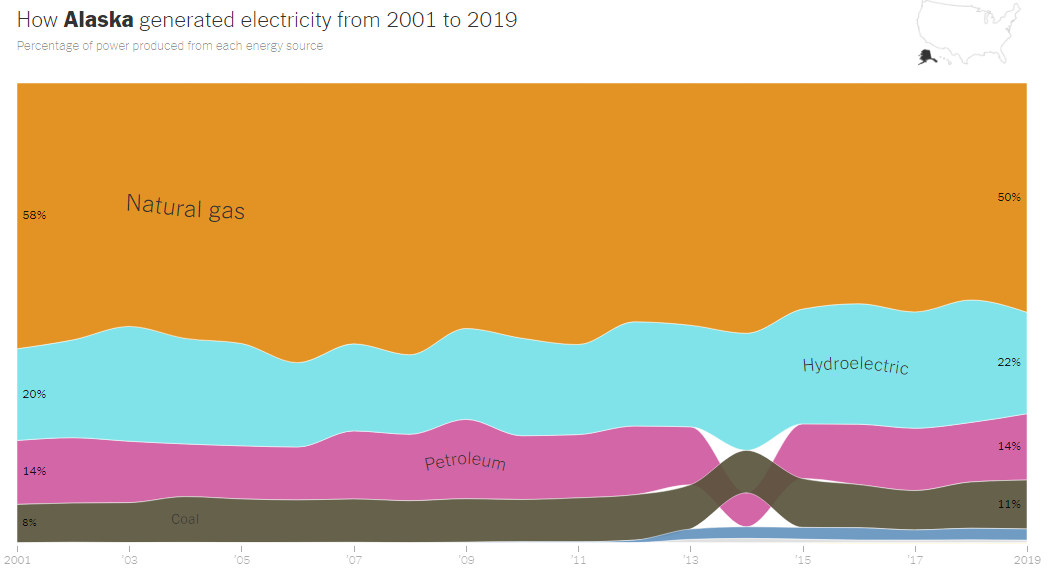
This graph shows Alaska’s electricity generation since 2001. It is based on data reported to the United States Energy Information Administration. It shows the relative percentages of each form of electricity generation.
Electricity can be generated using different methods. One way to generate electricity is by burning fossil fuels. Burning these fuels releases heat that can boil water to create steam. The steam turns turbines that can power an energy grid. A less efficient method of converting fossil fuel to electricity is necessary in smaller power plants and backup generators throughout Alaska; there, diesel engines or diesel-fired turbines are used. Petroleum (oil), natural gas, and coal fall into the category of fossil fuels. This type of energy production releases carbon dioxide and other greenhouse gasses into the atmosphere, contributing to climate change.
There is also renewable energy, which uses the natural world around us to produce energy. Hydropower harnesses the kinetic energy from flowing water. In Southeast we have relatively low flow, but lots of “head pressure.” In the lower 48, the large river system hydro plants rely more on flow. Wind turbines, powered by moving air, use the energy from wind in motion. Photovoltaic solar panels absorb solar energy from the Sun, converting it to electricity that we can use. Around 5-20% of the solar energy is converted to electricity. Geothermal energy uses the heat from the Earth’s core to create electricity, usually by powering a steam turbine.
This graph shows the different energy sources used to generate electricity in Alaska from 2001 to 2019. Note that this graph shows energy generation, the conversion of a fuel source (diesel, wind, etc) to electric energy. This is different from electricity consumption. Because of Alaska’s geography, its electrical grids are disconnected from the rest of the United States and Canada. This means that no electricity is imported to or exported from Alaska. Other states, by contrast, may generate as little as 2/5 of the electricity that they actually consume. In Southeast Alaska, the only communities connected to one another are Prince of Wales Island, Ketchikan-Wrangell-Petersburg, and the Haines-Chilkat Valley. It is also important to note that this graph only shows which energy sources produce electricity. Alaska produces additional energy, mainly through oil, but the vast majority is not used for electricity generation in Alaska. The crude oil is shipped out of state to be refined and then shipped back to Alaska for various uses including space heating and transportation.
Since 2001, Alaska’s electrical grid has mostly been powered by natural gas. In 2019, natural gas powered 50% of Alaska’s electricity. Large metro areas like Anchorage, the Matanuska Valley and the Kenai Peninsula use mostly natural gas. The second biggest contributor to Alaska’s electrical grid is hydropower, which powered 22% of Alaska’s electricity in 2019. Hydropower is most common in Southeast and Southcentral regions. Petroleum (14% in 2019) and coal (11% in 2019) come next. Smaller villages mostly use petroleum. Coal is used to generate electricity in Fairbanks. Wind power systems have been developed along the coast, along the road system and in remote areas.
Alaska went from having 11 wind turbines to having 59 in 2012, when advancements in technology made the construction of wind turbines more cost effective. The rise in wind power was also due in part to federal tax incentives. The incentives did not have as big an impact in Alaska as in other states because most of the utilities in Alaska are nonprofits and do not pay income taxes. There were two wind projects – one in Anchorage and one in Fairbanks – that were built by developers who did take advantage of the tax credits.
Direct federal funds have had some impact on increasing the use of renewable resources in Alaska. It was a federal grant that paid for a transmission line to connect Greens Creek Mine to Juneau’s electric system (dramatically reducing diesel usage by the mine.) The state of Alaska set up a Renewable Energy Fund in 2008 which has since funded a number of electric generation projects.
Looking ahead, the new federal infrastructure bill is written to make certain tax credits refundable for municipal utilities and coops, which will open other opportunities. Furthermore, with oil prices high again, the state is again putting money into the REF Grant program.
In 2014, petroleum usage fell. Coal usage remained constant, but the decrease in petroleum meant that coal became a larger percent. However this was temporary. The reason that the coal and petroleum areas switched places on the graph is that the colored bands are ordered from highest percent to lowest percent, and during 2014, petroleum’s percent was briefly lower than coal’s percent. Frankly, we’re still trying to figure out what caused that dip in petroleum.
Do you think this graph is easy to understand? If so, what makes it easy? If not, what aspects of the graph do you think are confusing or unnecessary?
Additional Resources:
- Alaska State Profile and Energy Estimates, U.S. Energy Information Administration
- Interactive Electricity Production Map, U.S. Energy Information Administration
- Wind Technology Briefing, UAF Alaska Center for Energy and Power
- Alaska Energy Authority Invests $4.9 mil in state’s largest solar farm (KTOO, 11/30/22)
A special thanks to Alec Mesdag from AEL&P for his assistance in this explanation.
Visualization Type: Stacked Area Graph
Data Source: U.S. Energy Information Administration
Visualization Source: How Does Your State Make Electricity?, NYTimes
It can easily be replicated. Go to the NYTimes article and select the state you want to see.
I noticed on the energy graph that there was a small blue section at the bottom that wasn’t labeled, as far as I could tell. There was also a small grey line, but that could have been part of the border. We don’t have any nuclear power plants in Alaska, is there a reason for that?
(not relevant to the graph questions but I really enjoy the graphs so far. I think it’s cool how much I’ve learned so far. Great work! :D)
Regan,
The small blue is wind and the very small grey is biomass. Did you see the key on the slide that compared Alaska to the US? That key – provided by the NYTimes – said grey is geothermal, but after doing some digging around and looking at other graphs, at the original data and talking with experts, we found out that there is no generation of electricity by geothermal in Alaska !! (though we do use geothermal for heat and there is generation of electricity by geothermal in other parts of the US – click on the electricity slides to see other parts of the US) We apologize that 1) we didn’t write in wind and 2 ) that we just assumed that the NYTimes information was accurate. (It’s wasn’t exactly NOT accurate, but it certainly was not complete).
I’m so glad that you’re enjoying these graphs and enjoying the learning that goes along with them. (Thanks for the feedback; super helpful and encouraging!) Me too! I have found out so much more about electricity and population and Alaska in the last few weeks than I ever knew before and the more I learn the more I know enough to want to know more!
We had Alec Mesdag, General Manager of Juneau’s electric company, come visit a class here. He said that he thinks there’s lots of potential for nuclear energy generating electricity in Alaska in the future. The technology has grown a great deal. He described small, very safe, fairly mobile nuclear generators that he thinks may be the answer to bringing the cost of energy (and electricity) in small villages way down.
If you click on the “reveal” about electricity, it will explain some more about wind and why (and where) Alaska started generating electricity from wind when it did. There’s also some other info provided by Mr. Mesdag that you may find interesting.
ok
I was confused why they didn’t tell us what the thin blue line was
Something I noticed about the Electricity Sources graph is that coal-generated and hydroelectric-generated energy has risen. I wonder if natural gas is going to stay the main energy source in Alaska. The reason I think this relates to me and my community is that if coal energy keeps rising it might affect the environment. A catchy headline for this would be, “Electricity and Alaska!”.
On the electricity sources graph, I noticed that half of the energy that is used is natural gas. I wonder what petroleum is and what it is used for. This graph relates to my community because my whole family uses these energies. A catchy headline for this graph would be, Alaskans all have Gas. that is everything I notice about this graph.
when i looked at the graph i saw that there were alot of different sections but they were all really mellow a catchy headline for this would be Alaska’s natural gass the good one
Willow,
By “mellow” do mean that the different sections didn’t change very much from year to year? Did you look at the graphs for some of the other states – or even for the US as a whole – they do a lot more changing! Any ideas why Alaska would be so mellow and other states not?
In the graph Alaska generated electricity 2001-2019 I noticed that the graph had a little gray stripe at the bottom of the graph. I wonder what that is? the graph relates to Alaska because it shows Alaska’s electricity sources.
With our Monday graph. One thing I noticed is that the coal and petroleum interfere/ with each other, why is that? Is there a reason why? What happened in the market then?
Caylin,
It looks like such a big deal, right? Two things: 1) it’s not as big a deal as it looks; there was a slight shift in % which changed the ordering and 2) we’re not really sure what happened. We’ve been asking experts and digging into the data. Our expert’s theory is that one of the petroleum (oil) plants went off line for a bit (because of malfunctioning). If we find out more information, we’ll revise the reveal.
In the Energy Sources for Alaska graph, I notice that ’06 has the most amount of natural gas used up for energy. I wonder why there is a lack of wind energy. This relates to me and the community by showing us where it might be that we could find clean energy sources. This graph shows us what type of energy is being produced each year. A catchy title for it would be ‘Powering Alaska’.
I would recommend other classes use this graph, especially if they were studying different types of electricity. Something that might improve this graph would be to have
faint vertical lines on the years because it is hard to see where each year goes. Furthermore, you could put a key for which color is which type of energy, that would help out the first suggestion because the words wouldn’t get in the lines. It would also help with the two lines on the bottom that aren’t labeled.
LIam,
Wind is the thin blue line that starts in 2012. The grey is biomass. Read my reply to Regan to get some more of the history and apologies for the lack of clarity. There was a key in the U.S. vs Alaska graph page, but that wasn’t very helpful for the beginning! I’ve added wind and biomass. I hadn’t thought about your (good!) point about how making a key for all colors would solve the problem of even the words that are there being hard to read. I just added a slide with the key to the begining. Adding the faint vertical lines would also improve legibility, I agree. I wonder whether it would take away from the aesthetics or just make it seem to cluttered. I will definitely talk with my colleague about that idea.
If you click on the “reveal” about electricity it will explain about wind energy 😉
i noticed that there was a lot of natural gas and a little bit of coal.
Erin,
Logan made an interesting point that the graph didn’t match what he actually sees. He said that he sees lots of coal and wondered about that. Have you see the coal in trains in the Interior as well?
This article explains more about why coal is still used so much in the Interior, even though it contributes so much CO2 to the atmosphere.
https://alaskapublic.org/2018/10/09/in-interior-alaska-reinvestment-in-coal-power-runs-counter-to-national-trend/#:~:text=All%20of%20that%20energy%20comes,supplies%206%20Interior%20power%20plants.
On Monday, we looked at the graph “How Alaska Generated Energy From 2001 to 2019.” Something I noticed on this graph was the tiny gray line at the bottom. I almost didn’t notice it because it was so small and light. I also noticed that the only energy source that was the same percentage in 2001 as it was in 2019, was Petroleum. Petroleum was represented in pink and was 14% in 2001 and 14% in 2019. It did not stay the same through the years. For example, it dipped in 2014, crossing paths with Coal.
Aliyah,
Isn’t interesting how consistent petroleum has been? Do you have any predictions for the future of petroleum – or the other sources – here in Alaska? How do you think those colors and numbers may change? And, how do you wish they would change? What would you do if you were in charge of Golden Valley Electric Association for the Fairbanks area?
On monday we looked at the electricity graph. I wonder what the thin blue line and the pinkish gray line are because they are not labeled. I also wonder why things changed so much between 2013-2015. I noticed that we have started using coal a little more recently which is weird because coal is not that good for the environment. The graph is relatable to people because everyone uses energy. I think some catchy titles would be “A Heated Topic” or “It’s Electric”.
I noticed that we had a lot of natural gas. I wonder what the blue sliver was.
One thing I noticed about this graph on energy was there was an unnamed blue line on the bottom. The blue started in 2012 and then continued on. A great title for this could be have you ever seen true power.
I notest that there is a riins coal and a dip in petroleum around 2014, then it goes back to normal. I wonder what caused the rise and dip.
Jacob,
I am really wondering about that dip as well – and it’s been hard to figure out the answer. The experts that we’ve been talking with are not certain. The latest theory is that a petroleum plant went off line (maybe some malfunctioning) and that changed the relative % of coal vs petroleum.
The graph that we looked up was Electricity sources. I noticed that there were two unlabeled strips on the bottom of the graph. They were small strips, but I wonder why they didn’t add a key or note on the side telling you what they were.
Last Monday I looked at a graph of the percentage of each source used for energy production. One of my main observations was that there is a lot of hydroelectric power being used which is strange because I don’t know many people who use that sort of energy.
I noticed on the graph that a lot of the energy we use is gas. Around 60-70% of our energy was gas. The graph surprised me because I see a lot of trains and stuff like that carry coal so the low coal persentage surprised me.
Logan,
That’s great that you’re comparing what you see around you outside to the words and numbers that others are using to describe your world.
This graph is showing electricity generation for all of Alaska, not just Fairbanks. If we could do graphs for each area within Alaska, they’d all be quite different. Juneau, for instance would be 99.7% hydroelectric! Fairbanks is a lot more diverse – as you can see in this list: https://www.gvea.com/services/energy/sources-of-power/
Your observation about coal is important – and so different from what we see here in Juneau. Not only do we see no coal, we see no trains! You all are (relatively) near the only coal mine in Alaska – the Usibelli Mine in Healy – and that coal is going throughout the Interior, so it makes sense that you see a lot of it. This article https://alaskapublic.org/2018/10/09/in-interior-alaska-reinvestment-in-coal-power-runs-counter-to-national-trend/#:~:text=All%20of%20that%20energy%20comes,supplies%206%20Interior%20power%20plants.
explains more about why coal is used so much in the Interior (cheap, easy to get) and, in fact, natural gas is used much less (more expensive, harder to get)
Keep observing and questioning!
One thing I noticed about this graph on energy was that there was an unnamed blue sliver on the bottom. The blue sliver started in 2011 and 2013 and then continued on. When looking at this graph I couldn’t come up with a creative title. I’m sure there are some good ideas, I just couldn’t come up with any.
I notest the graph has a little blue line at the bottom of the graph. I wonder what it represents. this graph relates to our community because it affects the kind of power we use. I think a catchy headline for the graph is “how much”.
I notice that natural gas is the main source of electricity in Fairbanks. I wonder why coal is the least used for electricity. I would recommend this to other classes. I think it is perfect.
Doug,
This graph that you looked at shows the sources of electricity for all of Alaska. This link: https://www.gvea.com/services/energy/sources-of-power/ will tell you about the sources for electricity specifically in Fairbanks. It looks like there’s a wide range – including coal, solar, wind, diesel (petroleum), hydroelectric and naphtha! From what I can tell, naphtha comes from petroleum, not from natural gas, so natural gas is one of the few sources NOT used for generating electricity in Fairbanks.
In general, most people are trying to move away from burning coal because it creates so much pollution and contributes to climate change.
Thanks!
Hi,
This is Brenda Taylor from the Juneau STEM Coalition. We’re looking forward to hearing your thoughts about these graphs and this project. I’m particularly eager to visit Jenny Strumfeld’s classes this week and hear what they say about the electricity generating graphs.
We’ve added some more slides of other states that have the highest % of particularly energy sources. Which state might you think would have the greatest % of solar, for instance? How about coal? Hoping to see some comments in this section. :))