
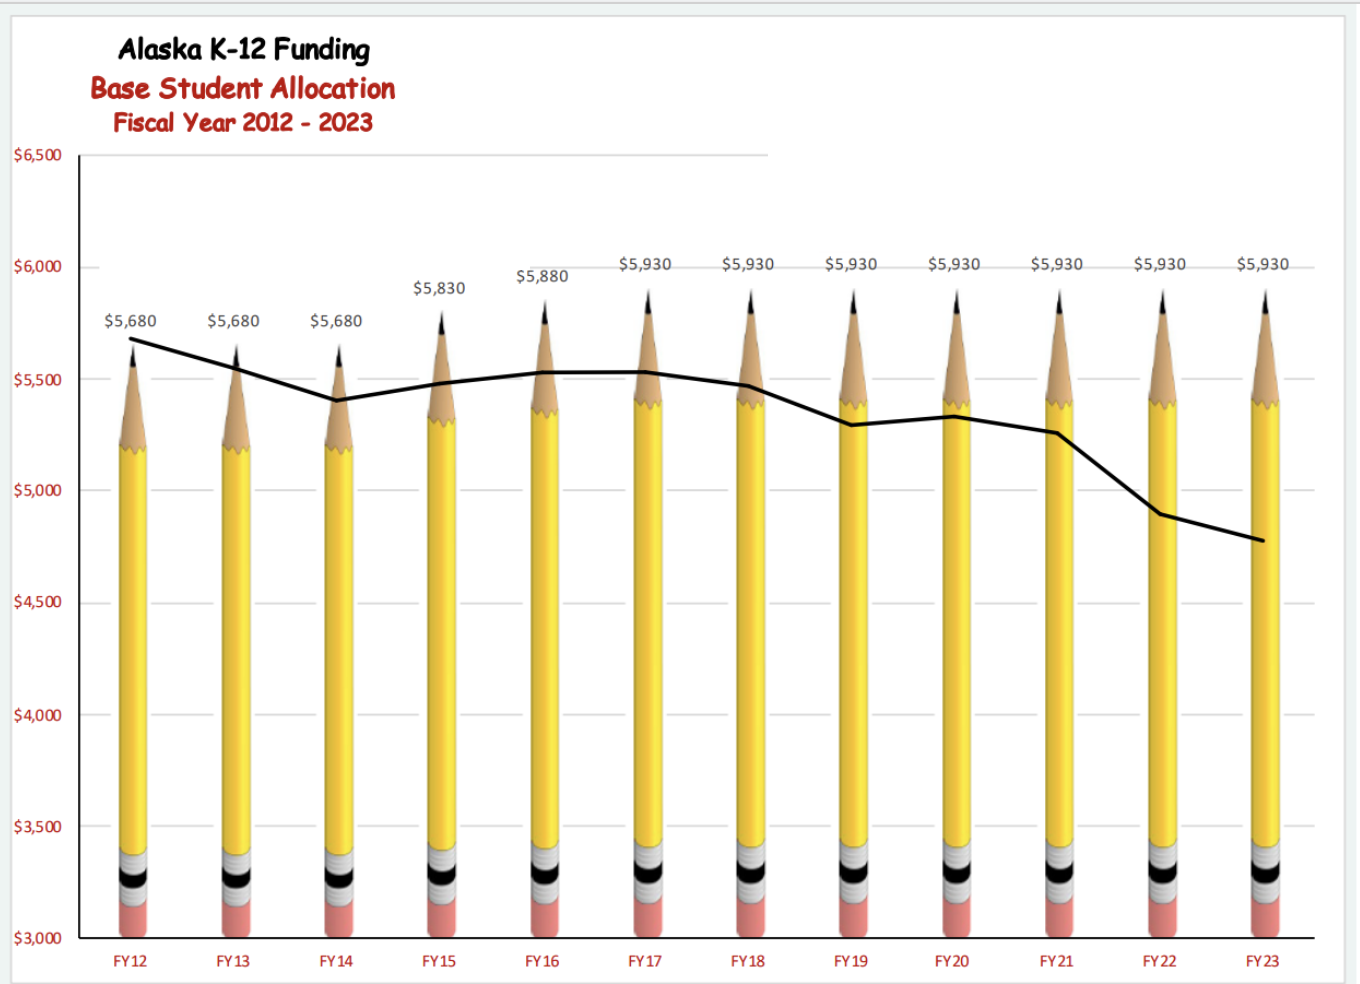
The top graph shows a comparison between Alaska’s K-12 yearly public school funding and the significantly decreased value of that funding due to inflation over the last eleven years, from 2012 to 2023. How should the State of Alaska decide how much money to distribute to the schools for education?
Background on Education Funding:
Determining the Base Student Allocation:
The yearly funding is based on the BSA (Base Student Allocation; a dollar amount per student), which is established in a law, voted upon by the Alaska State Legislature. That BSA amount is then multiplied by the AADM (Adjusted Average Daily Membership) to determine the amount for each school district; those numbers are all added together to determine Basic Need to determine the total education funding provided. The AADM is determined by the actual number of students (Average Daily Membership, or ADM) adjusted by several factors such as size of schools, cost of living in different districts, and additional costs for special education. The actual sources for the Basic Need funding is a combination of required local funding from municipal school districts, deductible federal impact aid (federal funds to, among other things, offset lands that are exempt from local property taxes), and State funds. There are also some additional state and federal funds, described below.
Other Education Funding in Alaska
Every year there is also a formula for funding transportation for each district. Slide 16 shows the match between funding allocated and actual transportation costs since 2013. In general, the allocated funds are less than the actual costs (fuel and staffing, primarily) which has meant that districts have had to use some of their BSA funds to pay for transportation.
Some years – as seen on the original graph (slide 8) there is additional one-time funding provided by the state that it is outside of and in addition to the BSA formula funding. That funding when reported as a lump sum sounds large, but when divided out per student (as in slide 11) shows up as a useful but not very significant increase for each school district.
There are additional funds coming into school districts directly via Title I (federal) funding, local municipal funding, and district or school generated grants and fundraising.
Inflation and the BSA
The BSA has not been increased since 2016 (i.e., FY2017), so education funding has not kept up with inflation. The question being hotly debated now in the legislature is how much to increase the BSA for Fiscal Year 2023-24 (known as FY24; synonymous with school year 2023-24). Districts across the state are reporting struggles as their costs – such as fuel, classroom materials, and insurance, – rise, but their funds remain constant. Some districts have closed schools and “many have cut staffing and services, increasing the number of students in each classroom.” (Alaska Beacon) In rural schools, funding deficits have a particularly large impact; schools cannot pay for needed repairs and, for instance, have to manage without water or close!
A wide range of remedies – and corresponding legislative bills – are currently being suggested. They vary widely in their approaches, including how much to increase the BSA, how to pay for it, how to plan for future inflation, and whether or how to include “accountability.” Last year, a $30 increase to the BSA was voted in to begin in FY 24. Additional suggestions and/or bills for FY24 range from $0 (from the governor) to $860 to $1000 to $1250. Refer to the resources list for more details.
Data Considerations and Visualization Choices

Visualization Source: https://www.akleg.gov/basis/get_documents.asp?session=33&docid=225
The creator of the “pencil graph” is the Alaska Council of School Administrators (ACSA), using data from Alaska Legislative Finance. ACSA represents school administrators and is working, among other efforts, to convince legislators to increase the BSA. ACSA made choices, in creating its graph, to emphasize the declining value of the BSA due to inflation over time, i.e., to make the inflation line look steep and dramatic. By contrast, the graph above, created by the Alaska Legislative Finance itself, made choices that show the decline, but do not make it seem as severe.
| Pencil Graph by ACSA (slide 4) | Graph by AK Leg Finance (slide 10) | |
| Scale | Every line = $500 | Every space = $1000 |
| Y axis start point | $3000 | $0 |
| X axis start point | FY12 | FY14 |
| X axis end point | FY23 | FY24 (proposed by Governor) |
| Inflation reference year | FY12 | FY22 |
| Difference in BSA value (adjusted for inflation) | $1154 in FY12 dollars | $1043 in FY22 dollars |
Making Comparisons about Education Costs
Comparing the cost of education within Alaska and between Alaska and other states is not simple and is, sometimes, political. Alaska generally ranks among the top ten in total dollars spent per student (around $17,000), however when the cost of living is factored in, Alaska ranks much lower. The Institute of Social and Economic Research at the University of Alaska Anchorage determines cost of living differentials among Alaska school districts; they also compare Alaska to the rest of the US. For that report, see here. Specifically, costs that are much higher in Alaska than other states and also much higher in Alaskan villages than in hubs are: health care for staff, energy, and the preponderance of small schools (which can’t benefit from efficiencies of scale and have more frequent and costly staff turnover. In addition, small schools in villages are disproportionately affected by climate change and climate or other hazard events.) ISER concluded that “… that by 2019, even though Alaska pays more than any other state on a per-student basis, the cost of living here is so high that once that factor is included, public schools here received less money than the national average.” (Alaska Beacon)
Written by Brenda Taylor, with frequent references to publications from Alaska Council of School Superintendents, Alaska Legislative Finance, and the Alaska Beacon.
Additional Resources:
- https://alaskabeacon.com/2023/02/01/alaska-senators-say-1000-increase-to-per-student-funding-is-beginning-of-a-conversation/
- https://alaskabeacon.com/2023/01/27/ahead-of-education-funding-bill-supporters-of-alaska-public-schools-make-their-case/
- https://www.akleg.gov/basis/get_documents.asp?session=33&docid=72
- https://www.akleg.gov/basis/get_documents.asp?session=33&docid=225
- https://alaskaacsa.org/wp-content/uploads/2023-JPS-Layout-final.pdf
- https://pubs.iseralaska.org/media/d0a6aae7-cb09-4bdc-bb13-6f992a6494b2/2019_09_30-EdCostSummary.pdf
- https://alaskabeacon.com/2023/02/14/alaskas-governor-should-fund-education-if-he-wants-to-attract-families/
- https://www.alaskasnewssource.com/2023/01/28/fire-newtok-destroys-village-schools-power-plant/
- https://www.akleg.gov/basis/Bill/Detail/33?Root=SB%20%2052
- https://www.adn.com/politics/alaska-legislature/2022/05/25/the-alaska-reads-act-narrowly-passed-the-legislature-policymakers-are-still-divided-on-its-benefits/
- https://www.alaskasnewssource.com/2023/01/28/fire-newtok-destroys-village-schools-power-plant/
- https://alaskapublic.org/2023/02/17/tuluksak-educators-plead-for-help-after-a-week-without-running-water/
Data Source: Legislative Finance
Visualization Source: https://alaskaacsa.org/wp-content/uploads/2023-JPS-Layout-final.pdf