
Slow Reveal
Notice, Wonder, Connect
Suggested Student Headlines: “Iditarod Search Trends in Alaska, What Do They Tell Us?”, “How Spikes Affect Us Most,” “The Trends of Your Home State Compared to the Rest of the United States,” “The Downfall of the Iditarod,” “Iditarod: Interesting Here Unknown There,” “How Popular is Sled Dog Racing?” “National Park Searches; Are They Popular or Not?”
This series of graphs explores trends in internet searches. Google Trends shows search requests made on Google and their relative popularity. We’ve included some of our favorite trends. It’s very easy to make your own that are best suited to your class’s specific interests; see directions below.
On each graph, the popularity of something is divided by the total number of searches in that area and time period and is scaled so the highest point is 100 and everything else is below that. Google does some other filtering as well. Topics with very few searches are treated as zero. Someone who searches the same topic a bunch of times in a short time frame is treated as one search.
Remember that while the data is scaled, it is still biased toward areas with lots of people within that region. So when looking at Alaska, results from Anchorage, Juneau, and Fairbanks will heavily shape the total number. You can see this with the phrase “snow day” which corresponds closely with when Anchorage School District experienced heavy snow. Remember that results show anyone searching from Alaska – tourists, workers, residents, etc. The dates that Google puts on the x axis are not very helpful as there are not enough or consistent enough tick marks to easily figure out the dates associated with peaks and valleys. When you’re looking at the graph “live” it’s much easier; then, you can click on any part of the line and it’ll say which week that data is from.
“The latest data shows that Google processes over 99,000 searches every single second. This makes more than 8.5 billion searches a day. (Internet Live Stats, 2022)….As of January 2022, Google holds 91.9 percent of the market share (GS Statcounter, 2022). […In contrast,] Bing has 2.88 percent of the market share, Yahoo! has 1.51 percent of the total market share. “ (Oberlo) That sheer volume of searches certainly shows that Google Trends is good for noticing patterns in the popularity of a topic, but remember that it’s certainly not the only or most comprehensive indicator of trends. Don’t forget to think about who is and who is not using the internet. And, what about people who use search engines other than Google?
Who might use this google trend feature? Why and how?
- Writers (bloggers) choosing what to write about and when to post so as to get the most clicks. (If you want to write about fishing, when should you post?)
- Businesses choosing when/when what to sell/how to advertise
- Reporters – what needs investigating?
- Ad writers – Developing an ad to match what people are interested in.
“Organic searches” and “organic traffic” are what shows up that’s independent of ads. Entire departments and companies are dedicated to advising other companies about “search engine optimization” (SEO). Their goal is to help your product/ad/story appear in the first page of google searches.
“Just like many other searches, Google is also a starting point for almost half of the product searches. 46 percent of product searches begin on Google (Jumpshot, 2018). With the latest data, Amazon surpasses Google when it comes to product searches, with 54 percent of searches starting on Amazon. The Jumpshot report shows us that Amazon and Google have been switching places from 2015 to 2018 in terms of being the preferred platform for users starting their product search.” (Oberlo)
“How does Google Trends differ from Autocomplete?
Autocomplete is a feature within Google Search designed to make it faster to complete searches that you’re beginning to type. The predictions come from real searches that happen on Google and show common and trending ones relevant to the characters that are entered and also related to your location and previous searches.
Unlike Google Trends, Autocomplete is subject to Google’s removal policies as well as algorithmic filtering designed to try to catch policy-violating predictions and not show them. Because of this, Autocomplete should not be taken as always reflecting the most popular search terms related to a topic.
Google Trends data reflects searches people make on Google every day, but it can also reflect irregular search activity, such as automated searches or queries that may be associated with attempts to spam our search results.” (google support.google.com)
What trends can you find? Go to: http://trends.google.com . When you type in a word or phrase, Google will allow you to look at the results for a “search term” or a “topic.” “Search term” is the default, so make a point to click on “topic” instead. “Topic” will give more complete results, including things like abbreviations, acronyms, the word in foreign languages, and other things that mean the same as your word or phrase.
Can you challenge yourself to find at least one trend where Alaska searches are?
- higher than the US as a whole
- lower than the US as a whole
- very similar
Visualization Type: Line Graph
Data Source: Google Trends
Visualization Source: Google Trends
It can be easily replicated. Go to Google Trends and search for a term. Then you can filter by time and region or add another search for comparison.
I noticed that Alaska seemed to be ranked higher on all of the trends. I wonder if that is because they were all about Alaskan things? But wouldn’t people it the lower 48 be more curious about Alaska? I think that it connects to me and my community because it shows that we don’t always know a lot about the place that we live in, and when we don’t know we just search it up. I wonder if this is due to the fact that so many people move in and out of Alaska so frequently? I also think that maybe people who use this data would be researchers, who would then find more information about the things that people are interested in, so that they could write more articles about them and people could be better informed.
what i can see is that hamburger are more popular and more searched than ham sandwiches and i find that cool because sadly i like ham sandwiches lol
what i can see is that hamburger are more popular and more searched than ham sandwiches.
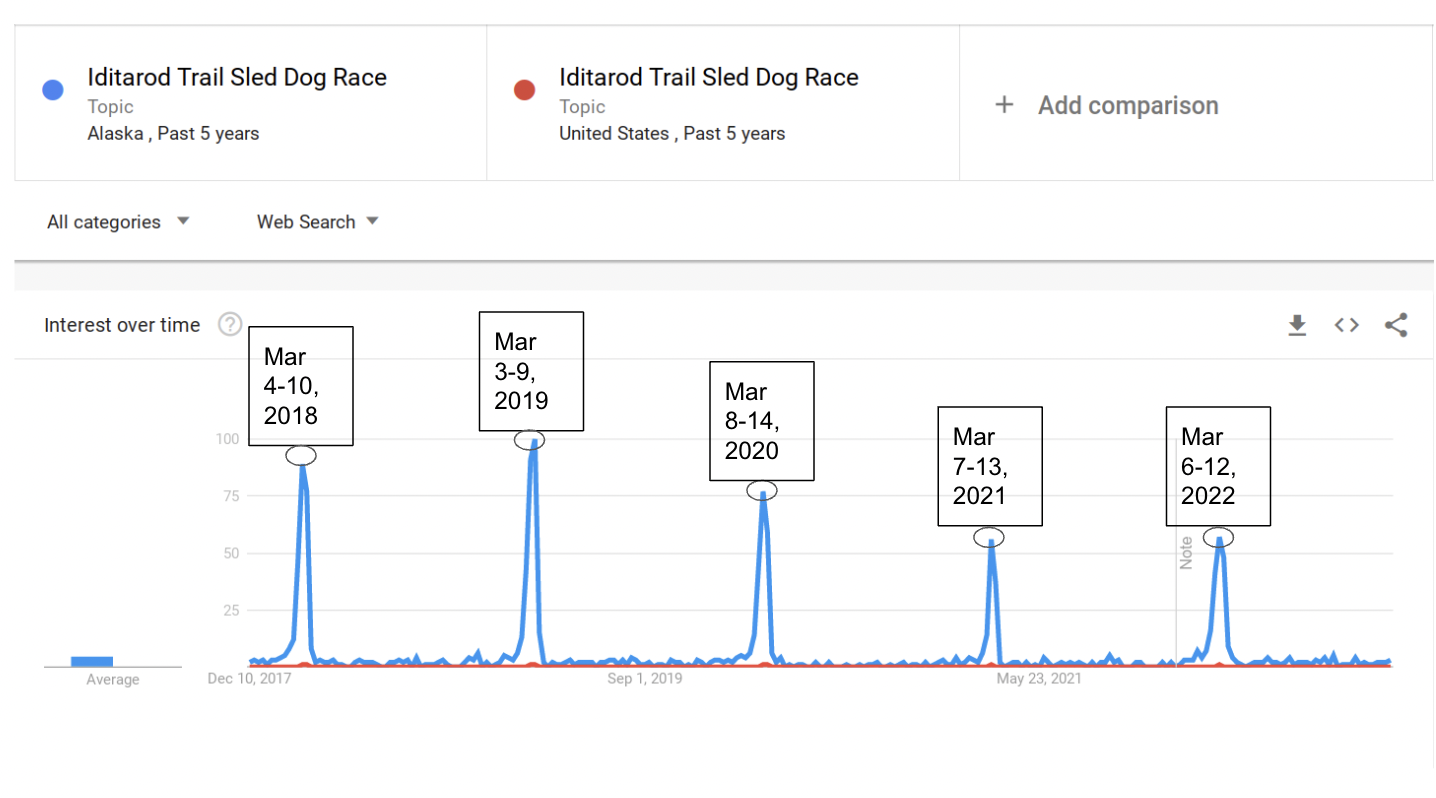
I Notice that the Iditarod Trail Sled Dog Race Search Trend is much more common in Alaska than it is in the U.S. I think that a person who could use this data would be a Sled Dog Racer Person. Sorry, I don’t know what they’re called. I think that they would be able to use this because they would be able to tell when the Iditarod Trail Sled Dog Race would be coming up.
Alex,
I agree that the Iditarod is looked up much more frequently (as a percentage) in Alaska than in the rest of the U.S. I don’t know the exact term for the Dog Racer Person, but maybe musher is part of it? The mushers who are actually racing probably do look up the date – or they might already be on email lists alerting them. I’m noticing that there’s a huge upsurge in Iditarod searches leading up to the week of March 4-10, 2022 and following. The race began March 5 and was over March 19 that year. So probably racers were checking in before the 5th for race info, but they probably weren’t checking the internet as they were racing across the tundra. Who was doing the searching DURING the race, do you think?
I notice that the search trends about the Iditarod Trail Sled Dog Race is a lot more common in Alaska than it is in the United States. I would think that a person who could use this info would be a Sled Dog Racer person. I don’t know what they’re called. They could use this because they would know when the Iditarod Trail Sled Dog Race would be happening.
Why is the sled dog trail so popular for only 6 days a year every year? I’m wondering what the red line is. I also noticed that it gets less popular every year why?
why is the sled dog trail so popular for only 6 days a year every year? im wondering what the red line is. i also noticed that it gets less popular every year why?
Addie,
Those are the same questions I’m wondering about. I looked up when the actual race was in 2022; it was March 5-19 and the searches were most common around March 4-10. Who do you think is doing those searches and why?
The red line is searches (relative to 100) in the rest of the U.S. – vs Alaska. Do you see any changes in that line over time? Do you know why it’s so much lower than the blue line?
As for the popularity, that’s certainly what the trends are showing! I’m guessing that has the producers of the race worried and wanting to reverse that trend. Some reaons that I can imagine fewer people are interested – 1) Covid changed everything and fewer people were traveling to watch the race and 2) I know there’s lots of discussion among some people about the impact on dogs. Some people think it’s not fair or maybe even cruel to dogs. Others think that dogs love racing and are well loved and cared for. I don’t know enough to have a personal opinion
why is the sled dog trail so popular for only 6 days a year every year? im wondering what the red line is. i also noticed that it gets less popular every year why?
I notice that most of the searches have about equal distribution. I wonder why that is. People who might use this data are people who are making headlines for news. This data leaves out most of the searches in Africa. I think this is because there are not as many computers in Africa. I wonder if the search analyzer accounts for the population of certain areas.
Something that I noticed was that every March, Alaska spiked pretty high. This connects to me and my community because the Iditarod is something that happens in Alaska every year. I think a catchy headline for this graph would be “Iditarod Search Trends in Alaska, What Do They Tell Us?”
Kerris,
Some of your classmates were asking why the Iditarod spikes in March and who’s doing the searching. What would you say? And, do you have any answers to your own question (in your headline)? I’ve put your headline suggestion up at the very top of the “analysis” on this page. Let me know if you have thoughts about what the search trends tell us and I’ll add that in too.
Thanks!
I noticed that youtube was the highest
Something that I noticed was that every March, Alaska spiked pretty high. This connects to me and my community because the Iditarod is something that happens in Alaska every year. I think a catchy headline for this graph would be “Iditarod Searches in Alaska, What Does it Tell Us?”
i’m actually kinda surprised with all the google trends and, i’m more surprised with how they spike up in march, i don’t think there could be a better headline\name for this its pretty direct and makes sense.
Sam,
Could you say more about you mean about being surprised “with all the google trends?” Which trends and what was surprising about them? Are you talking about the Iditarod Sled Dog Race in particular. The race is early March every year; what do you think the connection might be?
I wonder why the searches spiked up around march 10th I notice that the us don’t search as much.
Kayla,
The Iditarod races are always held in early March. In 2022, for instance it began March 5 and ended March 19. Why do you think people in Alaska would do more searching (relatively) about the Iditarod than people in the US as a whole?
I feel like a catchy headline would be like “How spikes affect us most”
I did my research on overall interest, and I was wondering how this affects banks and the money system. I noticed that this spiked every 2-3 months, which is an interesting pattern.
This affects my community, since if this is directly linked to the interest in banks, then you could only imagine how upset the people would be.
When I looked at this data, I noticed that there seemed to always be a slight amount of searches after any events that happen. I wonder how exactly the algorithm for this website works, and exactly how the searches are framed/scaled. I also wonder what the score means, and how to find how many searches there were in that month. This could connect to my community by, if I select my specific city in the map/area select, seeing what exactly people are searching up to see if I can do anything about it. Something that these graphs leave out is what the grading means, like how it is scored or whether is it on percentages from the most searched thing for the period. An impact of that is that, if you search for two things together, it might seem like one is much more popular, but compared to another thing, they are both blown out of the park.
After looking at the Google trends, I’m curious why the interest rate has gone up so much in December of 2022. And I wonder why it was so low in September. I’m curious to look more into this. And this connects to our community in a few ways, and I feel like I think that if this is overall interest, it will have some effects on banking stuff, although I can’t speak on that too much since I don’t know what they’re doing at the banks. And I looked at overall interest :).
I feel like a good headline would be “How spikes affect us most”
Caylin,
I’m glad that you took the time to look up something that interested you – and that it generated lots of questions — that I certainly don’t have the answers to. I’m going to do a cut and paste and forward on to someone else who might be able to answer your questions. I put your headline in collection at the very top of this page.
Caylin,
Could you tell me exactly what you typed in – word/phrase and topic vs term and Alaska vs US? I tried typing in interest rate, but I didn’t get the same dip in September and spike in December. Or, best, take a screenshot and email it to me at juneaustemcoalition@gmail.com so I can see what you’re seeing and pass that on to someone who could answer your questions.
Thanks,
Brenda
Caylin,
I’m continuing to think about what you wrote. Did you mean that it said “interest over time” in the left? What did the graph/slide say at the very top?
looking at the Google Trend above I noticed the Iditarod being in Alaska, we were well above the US, and it only spiked during the racing season. I wonder if other places with similar activities relate. This relates to my community and me because first of all, I live in Alaska. A catchy title for this one I thought of is Dog lead Racing.
Kolton,
Interesting speculation. Have you tested it? Let me know what you find out.
Brenda
While reviewing the graphs I noticed that the searches for the Iditarod significantly dropped in 2021 and regained a little bit in 2022. I wonder why there was such a big drop in searches in 2021. I feel that people who are interested in learning about the Iditarod or have people they know in the Iditarod are the bulk of the people searching this topic.
One catchy headline would be “The Trends of Your Home State Compared to The Rest of The United States”. Someone who might use this information would probably be someone who was really interested in which of the two searches was more popular.
I noticed that the one that I chose spiked every couple of months.
I think that a catchy headline for this would be “The downfall of the Iditarod” because of the decrease in numbers. I think the people who are running the Iditarod could use this information to increase viewership.
Dear Anonymous,
I agree that the people running the Iditarod could – and should – use this information to assess their viewership. It’s a pretty significant drop. I’m kind of curious what happens before 5 years ago; has it be been dropping forever? It looks like it peaked in 2007/8 and 2013. Covid hit it hard, for sure.
Can you see yourself ever using Google Trends?
Brenda
I think that a catchy headline for this would be “The downfall of the Iditarod” because of the decrease in numbers. I think the people who are running the Iditarod could use this information to increase viewership.
Charles,
I replied to you as Anonymous. See above.
Brenda
I noticed that on the salmon graph that the spikes were around when the salmon runs are up here. The national average on the interest in salmon was a little more bumpy than some of than it was on some of the other ones I wonder if that is because quite a bit of salmon fishing is done in california. I think that because here in Alaska we have a lot of people who don’t have internet and the graph leaves them out also with us having tourists up here which are more likely to be searching this type of stuff so that would obscure how much alaskans actually are interested in these things. Newspapers could use this information to know what stories to focus that are going catch the most people’s attention.
I looked at all the intriguing google trends data, the one about the Aurora caught my eye the most. I noticed that in 2017 between June and September the Aurora spiked up by far in Alaska. I also noticed that the Aurora isn’t really searched up in the U.S at all. U.S is however Evened out while Alaska is everywhere. I wonder if in the future there would be more or less searches in Alaska and U.S. I also wonder in other countries if it would be the same. I think Tourist might use this data when they come over here or planning to come to Alaska.
Will,
Kudos to you for examining a different graph than your classmates – and not just the first one that you came to. :). I agree that tourists would be doing lots of searches when they are in Alaska or when they are planning their trips. I’m curious about the huge spike in September. I’m wondering which group that is – the people here or the people planning? Although the Aurora happens throughout the year, it’s most easy to see during the darker months. In Fairbanks, that would be Sept-March. In Juneau, that time would start sooner.
Looking at this graph, I noticed that the graph always spikes in March for Alaska. Why is the Iditarod in march when everything starts to melt and not in any other months that are colder? I knew a few people in my neighborhood who would train sled dogs and would go sledding around the swamps when they were frozen, but I don’t think that they participated in the Iditarod. I think a good name for this graph would be ‘Iditarod: Interesting Here Unknown There’ because in Alaska the Iditarod is a big deal, but to the rest of the U.S. it probably isn’t.
I notest that most winter or fish and wilderness searches are found in Alaska. this information could tell someone where most fish are or were to go hunting.
I notice that Iditarod only spiked when it was the racing season. People that can use this graph are the people doing the Iditarod because they can see when it is because of the huge spikes.
One thing I noticed was that the search trend “National park” had a lot of up and downs for Alaska while it was fairly stable for the rest of the United States. I wonder if there was some reason of why Alaska had such up and downs for the search “National park”. I know that in Alaska that there is 17 national parks and that some of them are only accessible by air transportation so maybe people were curious about that. If I had to give the graph a catchy headline I would name it “National Park Searches; Are They Popular or Not?”.
Claire,
I’m glad that you had time to look at all the slides and choose one that interested you more (or maybe it wasn’t a choice?). One thing to think about is that these numbers are relative and not absolute. There are more searches about National Parks in Alaska RELATIVE to other searches than there are searches in the US as a whole, relative to other searches. One thing that I hadn’t thought about is that the searches that show up as “Alaska” are not only people who live in Alaska full-time like us, but also people who are in Alaska (traveling or working or whatever) when they are doing the searches. I’m guessing that lots of tourists search for national park information while they are visiting and that those tourists are a bigger proportion of the searches during the summer than other visitors are to other places in the US that have bigger existing populations. I put your title in at the top of this page with other titles. Thanks for all your thoughts!!
After looking at the Google Trend above I noticed that since the Iditarod is only in Alaska, we were quickly above the US. Also, it only spiked during the racing season. I wonder if other places with cold and snowy locations like parts of Canada or other areas. This relates to my community and me because first of all, we live in Alaska. Also, my dad used to sled race so I’m aware of how popular it is. One final thing is that Alaska is one of the very few places in the world where you can experience the full fun of the race. The cold, keeping warm with the dogs, and the wind and snow. I don’t really have a catchy title for this but one I thought of is How Popular Is Dog Racing?
After viewing this interesting google trends data, I noticed that even after the Iditarod spike in interest during the race, there are still some searches during the rest of the year. I wonder if there are any searches for the Iditarod in Canada or other countries with sled dogs. This data definitely shows the feelings of my community because during the Yukon Quest and Iditarod People are much more interested in sled dog racing.
George,
Do you have ideas about why people would search for the Iditarod outside of when the race is happening? I’m curious about your question about if the Iditarod would show up differently in other countries with sled dogs. Will you do a google trends search and let us know? We’d love to hear!
Brenda